5.5 Setting the Graph Display Method
187
5
Chapter 5 ANALYZER Function
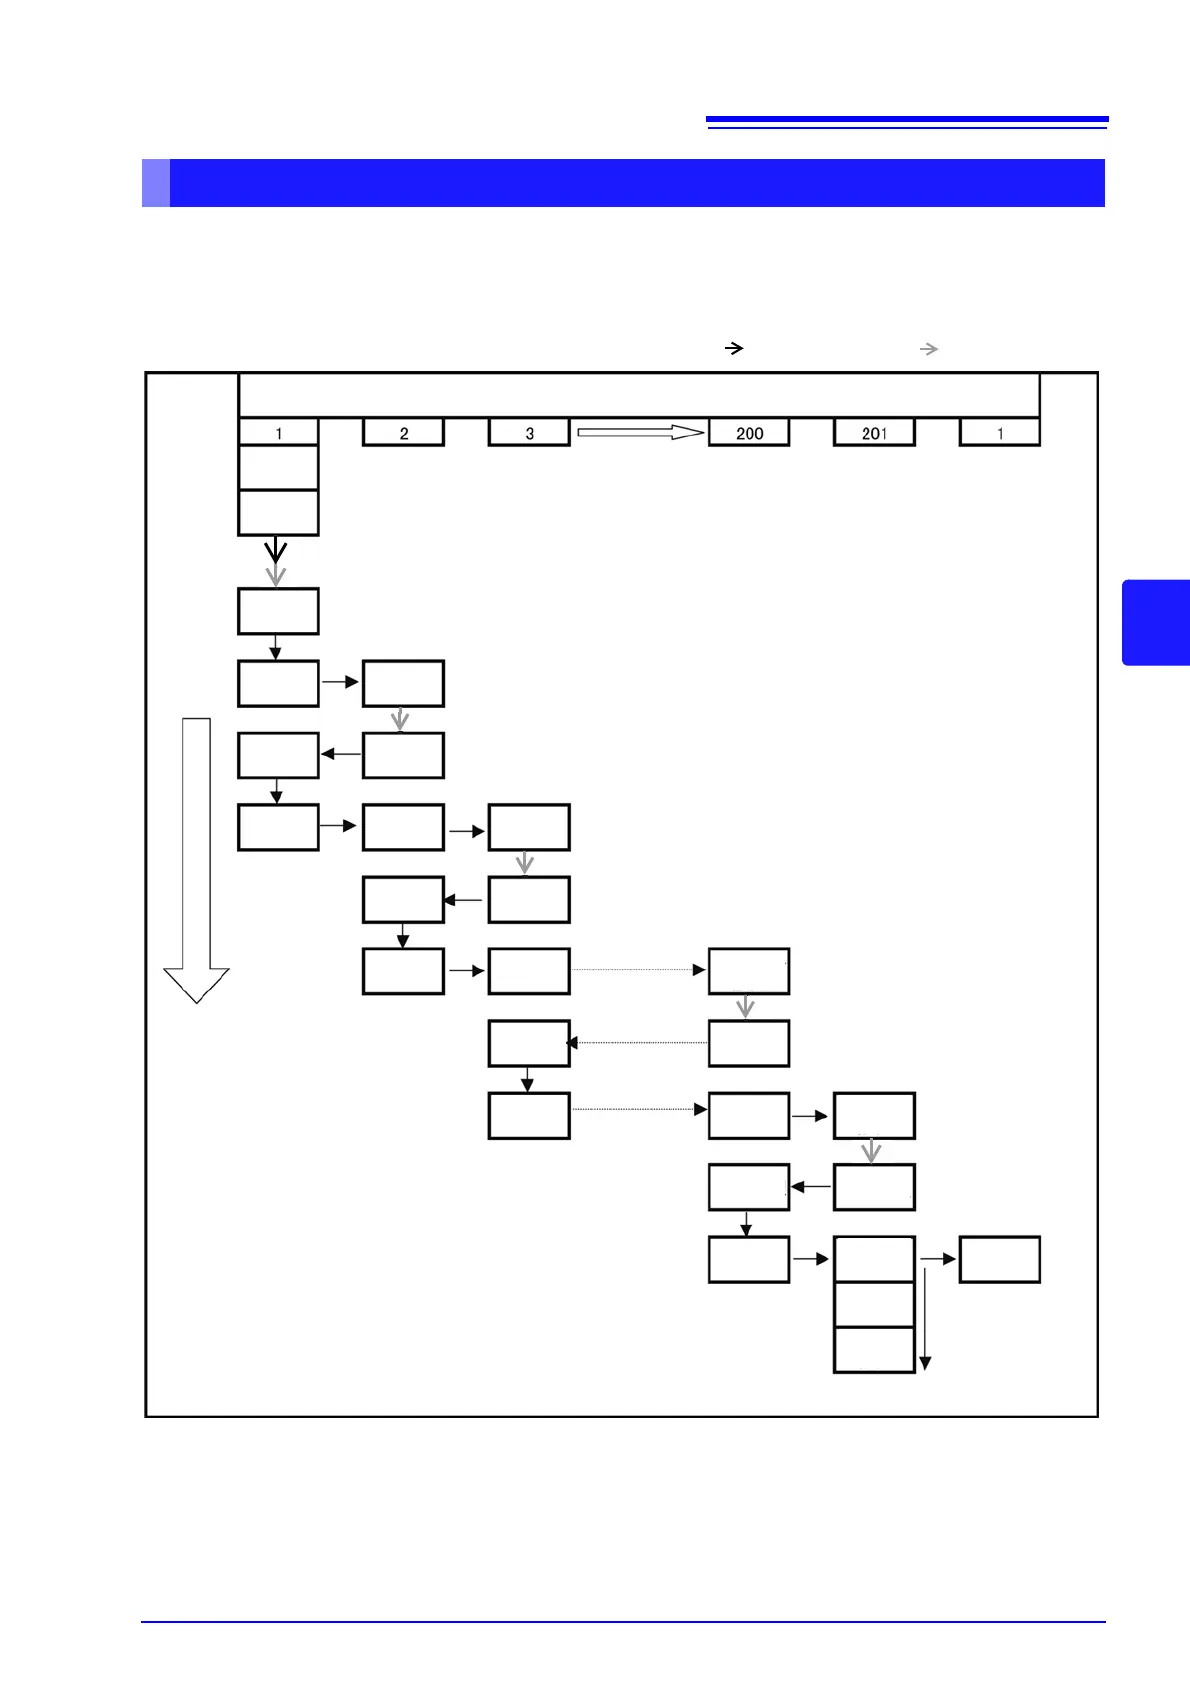
With this instrument, in order to perform analog measurement efficiently, the timing with which measurement
is actually performed and timing with which the data is reflected in the graph differs slightly.
The following shows the timing with which analog measurement is performed continuously for multiple mea-
surement points and the timing with which the graph is drawn.
: Trigger delay (p. 140) : Point delay (p. 166)
About the Timing for Graph Drawing
Time
Sweep direction
Setting of
measurement
condition
Drawing of
graph
Calculation
processing
End of ana-
log mea-
surement
Start of ana-
log mea-
surement
Setting of
measurement
condit
ion
Setting of
measurement
condition
Start of ana-
log mea-
surement
End of ana-
log mea-
surement
Calculation
processing
Drawing of
graph
Setting of
measurement
condition
Start of ana-
log mea-
surement
End of ana-
log mea-
surement
Calculation
processing
Drawing of
graph
Setting of
measurement
condition
Start of ana-
log mea-
surement
End of ana-
log mea-
surement
Calculation
processing
Drawing of
graph
Drawing of
graph
Calculation
processing
End of ana-
log mea-
surement
Start of ana-
log mea-
surement
Trigger
Setting of
measurement
condition
Sweep point