5.10 Equivalent Circuit Analysis Function
263
5
Chapter 5 ANALYZER Function
When the IM9000 Equivalent Circuit Analysis Firmware is installed, you can generate an X-Y display of mea-
surement results. This display consists of a graph with measured values for the No. 1 parameter on the X-axis
and measured values for the No. 2 parameter on the Y-axis.
Parameters can be combined to create Cole-Cole plots and admittance circle displays.
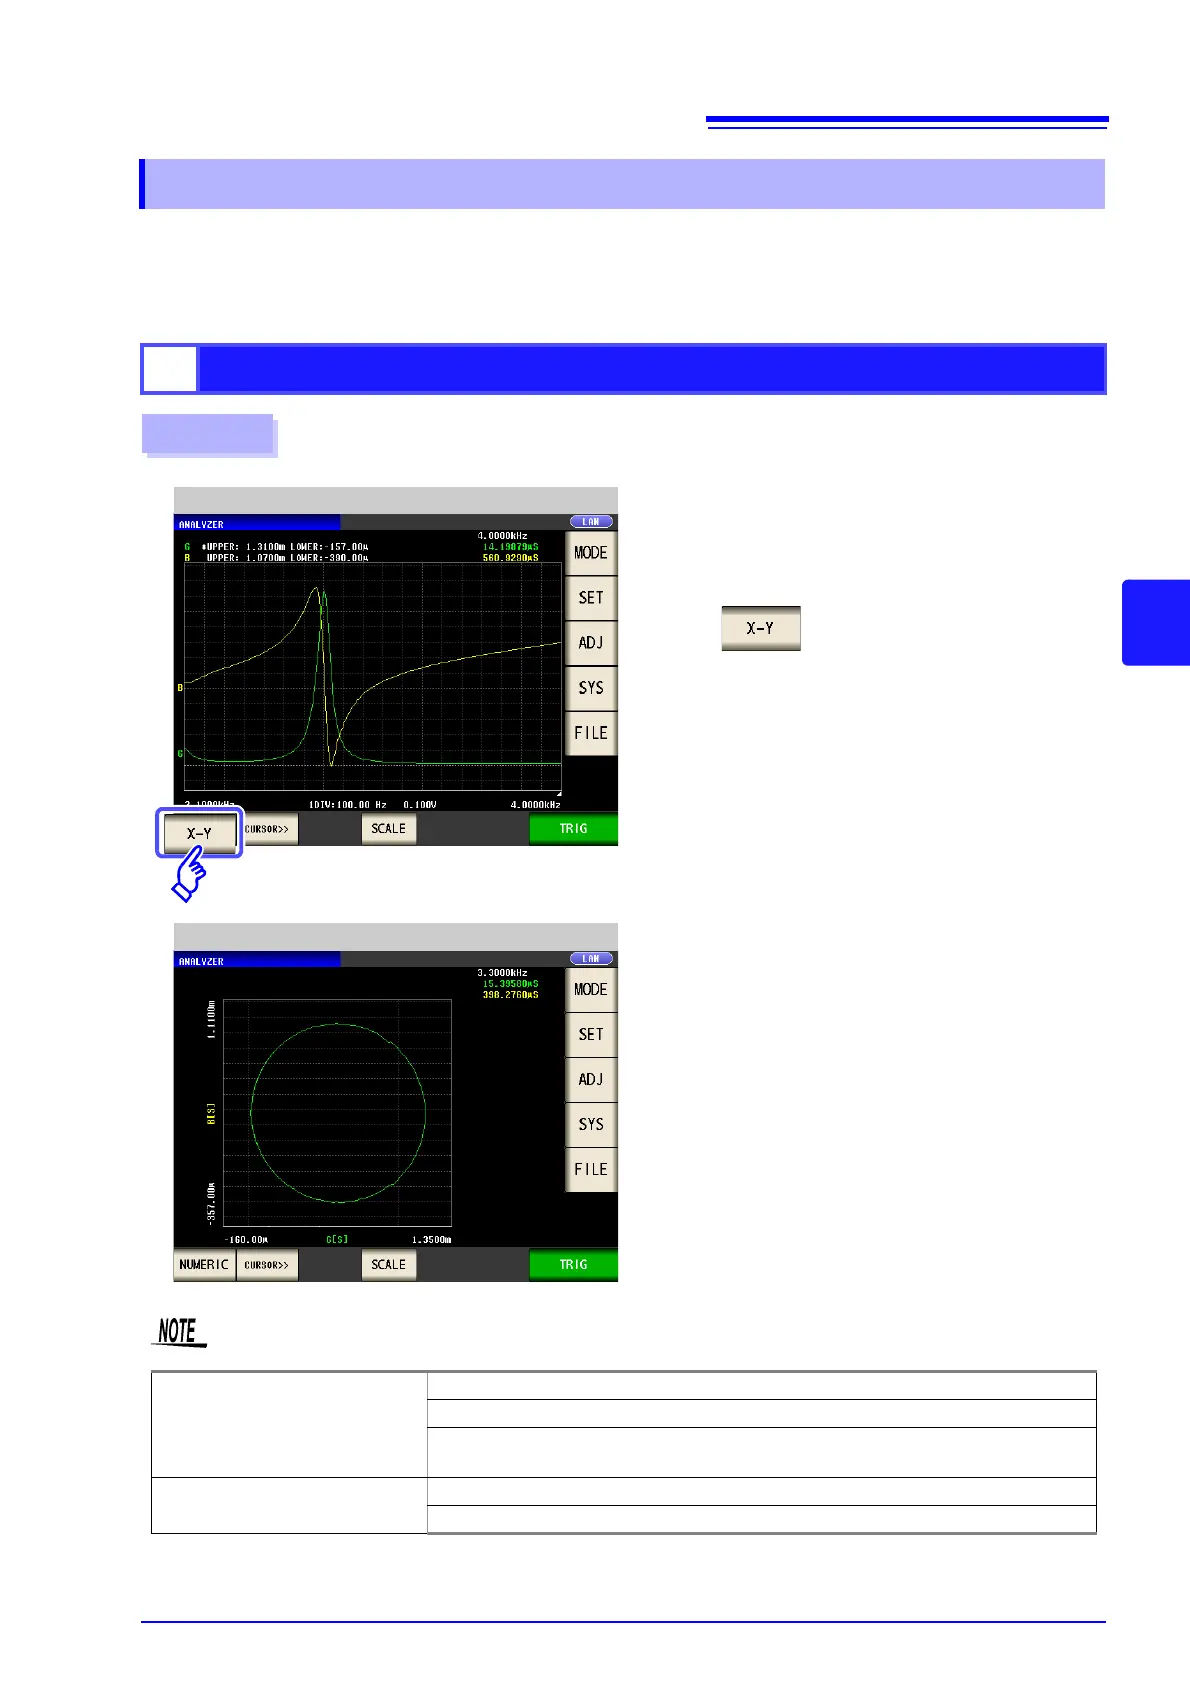
5.10.6 Generating X-Y Displays
1
Creating an X-Y display
1
2
Analyzer Initial Screen
Press .
X-Y display screen
Procedure
To display a Cole-Cole plot or admittance circle, make the following settings:
Cole-cole plot
Set the No. 1 parameter to Rs.
Set the No. 2 parameter to X.
Reverse the No. 2 parameter's polarity (set the compensation coefficient to A = -1
with scaling compensation).
Admittance circle display
Set the No. 1 parameter to G.
Set the No. 2 parameter to B.