5.10 Equivalent Circuit Analysis Function
259
5
Chapter 5 ANALYZER Function
The difference between observed values and simulated values is calculated for each mea-
surement parameter in order to judge the suitability of equivalent circuit analysis results. The
frequency range that was analyzed or the frequency range for the segment number that was
analyzed is used as the range for calculating this difference.
The difference is calculated using the following procedure:
(1) The squares of the difference between each observed and simulated value pair for the
frequency sweep count are added together.
(2) The result is divided by the frequency sweep count to obtain the mean residual sum of
squares.
(3) The square root is calculated.
More concretely, this can be illustrated as in (A) below:
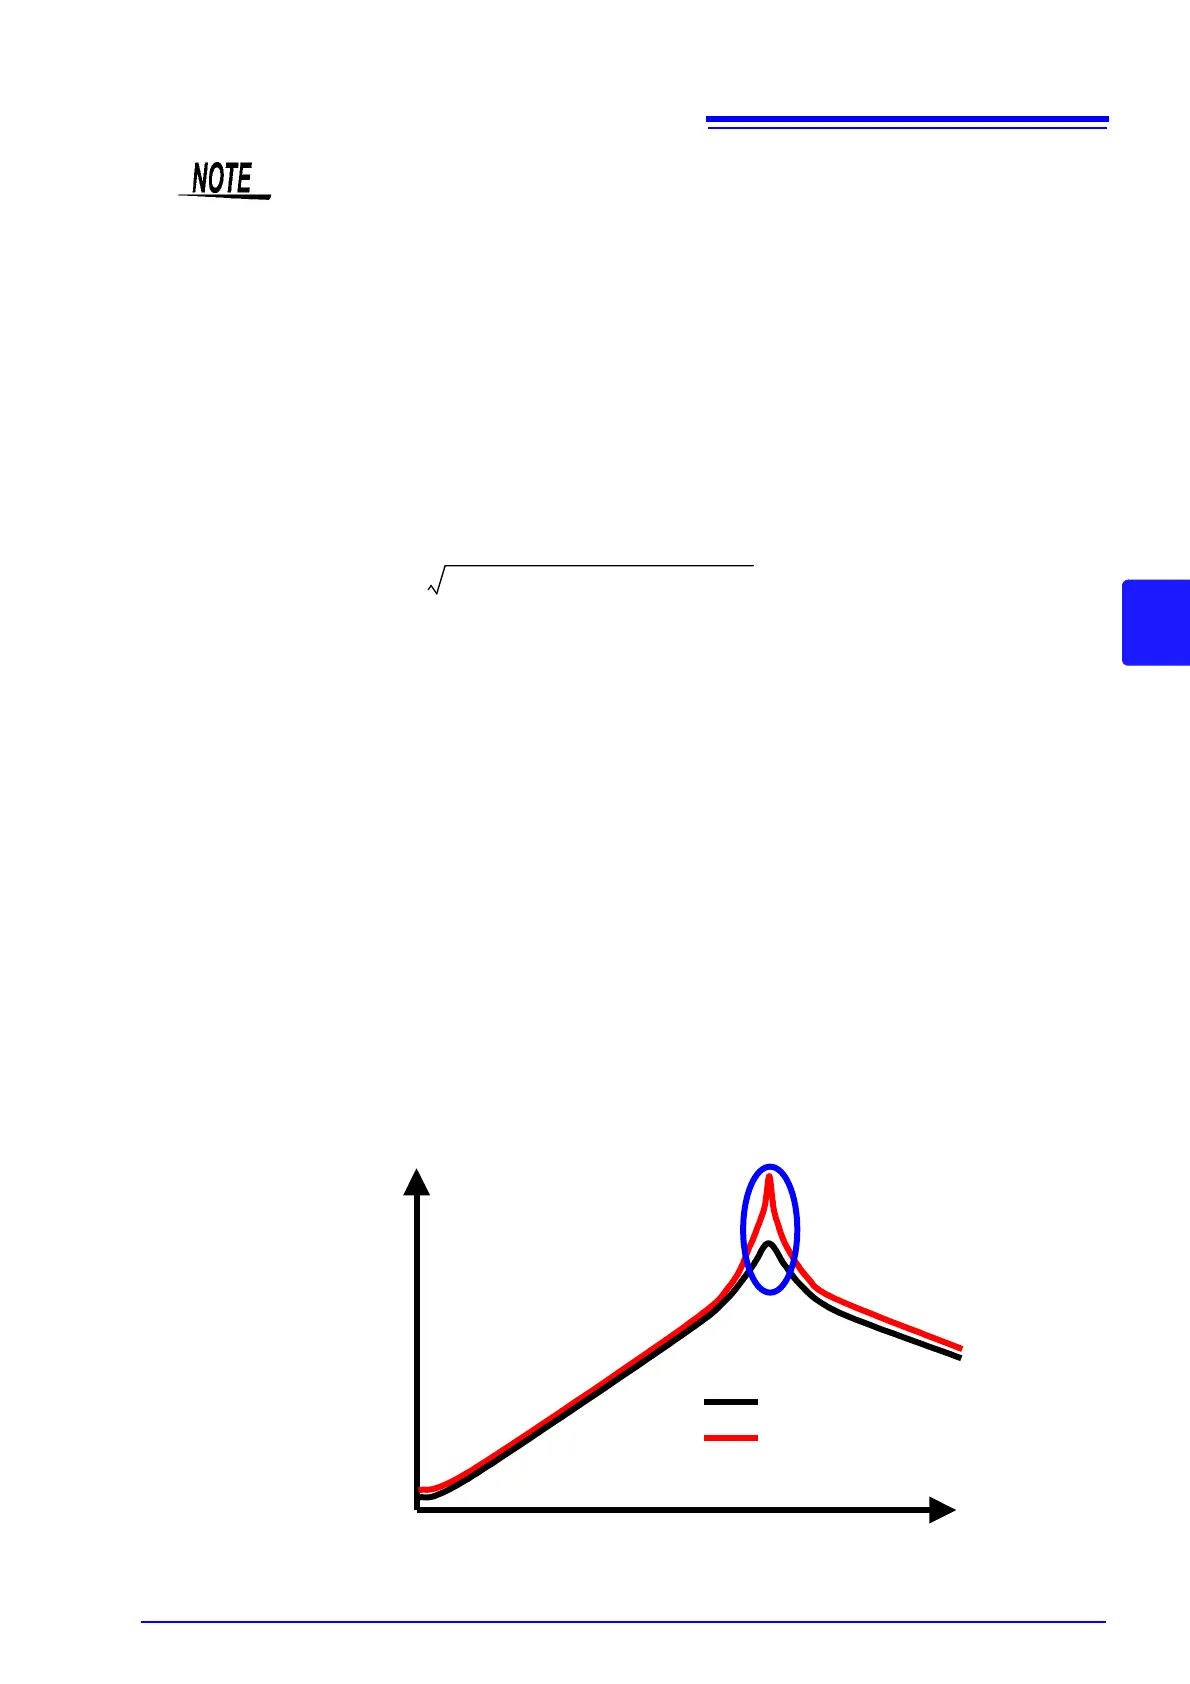
However, when using this method with circuits whose impedance frequency characteristics
exhibit local extreme values (local maximum or local minimum values), difference values for
frequency ranges that do not contain local extreme values will be less than difference values
for frequency ranges near local extreme values, as shown in the figure below. Consequently,
the circled area in the figure is excluded when calculating the difference between observed
and simulated values. The following calculation procedure is used for the circled area:
(1) The difference value calculated by adding a quantity A to the observed value for the
measurement frequency that generated the local extreme value is used as the upper
limit value, and the difference calculated by subtracting the quantity A from the observed
value for the measurement frequency that generated the local extreme value is used as
the lower limit value.
(2) If the simulated value for the measurement frequency that generated the local extreme
value falls outside the range defined by the upper and lower limit values calculated in (1)
above, the upper and lower limit values for the observed values before and after the
local extreme value are calculated as in (1) above and repeatedly compared to the
simulated values.
(3) If the simulated value falls inside the range defined by the upper and lower limit values
for the measurement frequencies before and after the local extreme value, the area is
used to calculate the difference, and the areas used in (1) and (2) above become the
circled area.
xxxxxxxxxxxxxxxxxxxx
(Observed value Simulated value)
2
/ n (A)
n = Sweep count
Z
Frequency
Observed values
Simulated values