2.24
SEL-400 Series Relays Instruction Manual Date Code 20171006
PC Software
Analyze Events
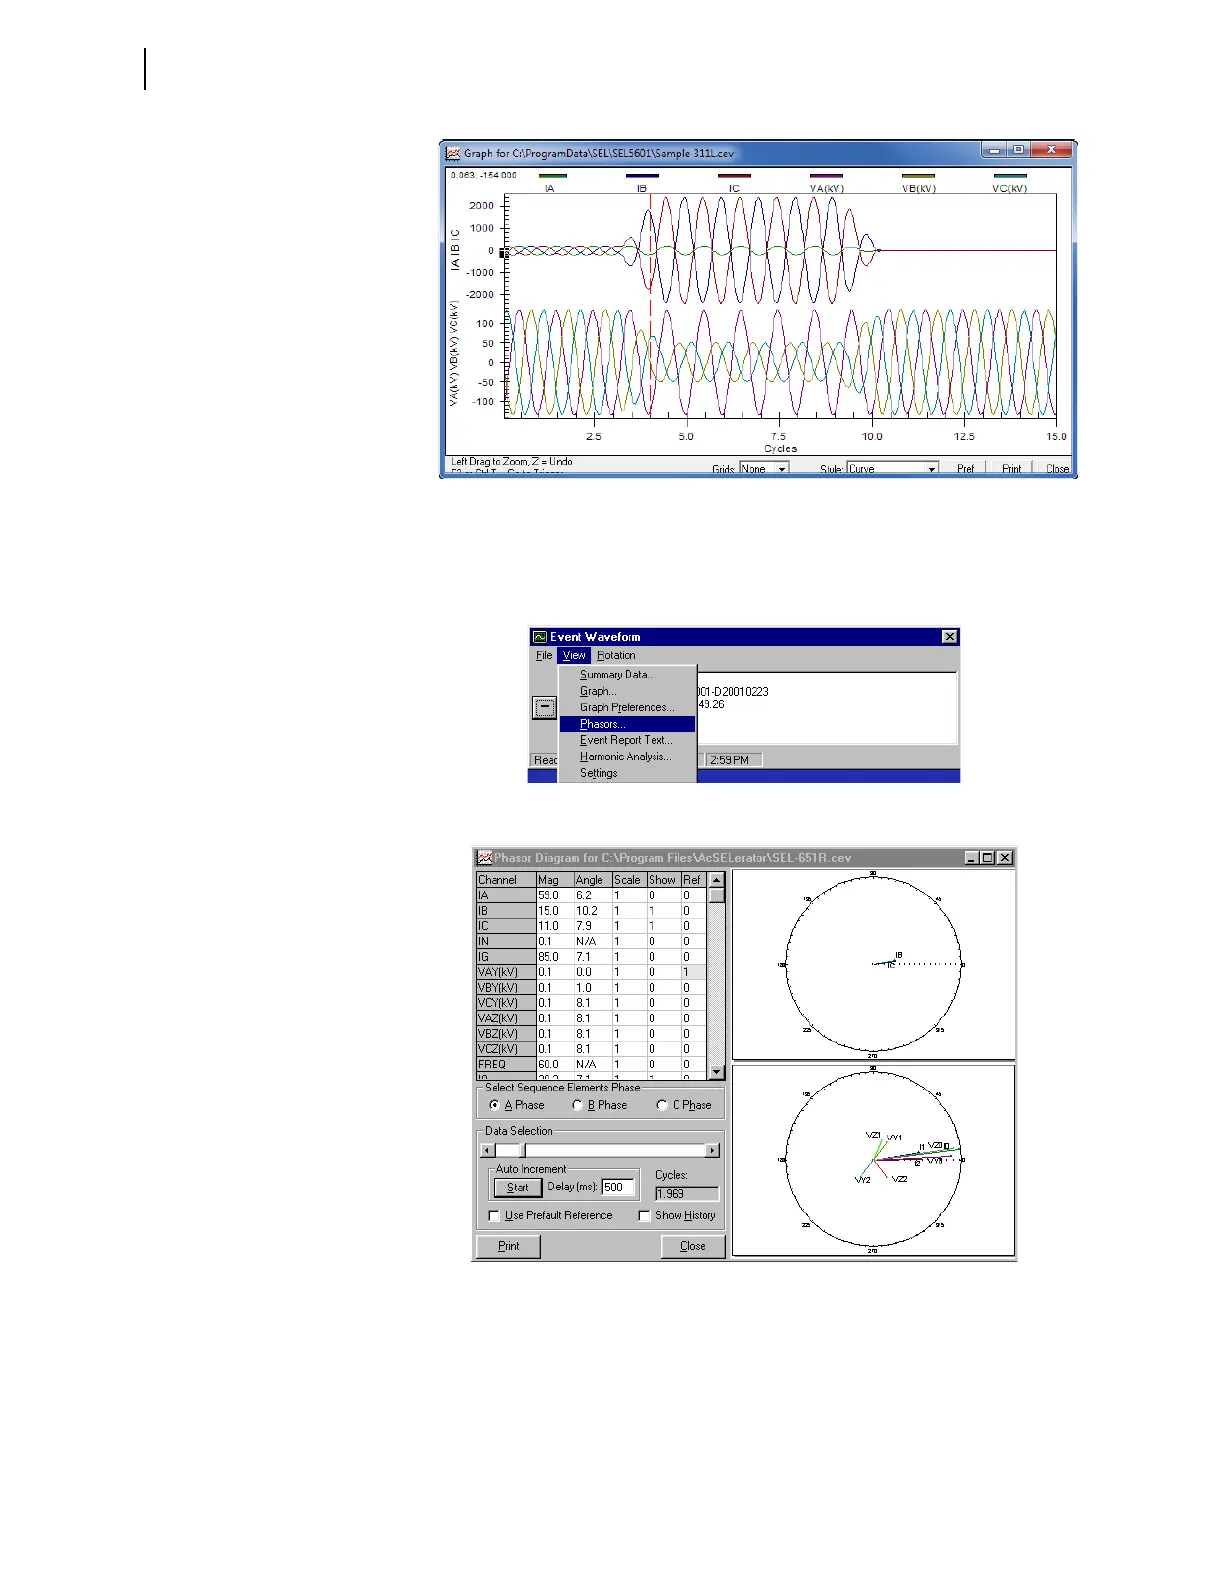
Other event displays are available through the Event Waveform dialog box.
Select the View menu and click Phasors, as shown in Figure 2.23, to view a sam-
ple-by-sample phasor display. The phasor display should be similar to Figure 2.24.
QuickSet also presents a harmonic analysis of power system data for raw data
event captures. From the View menu, click Harmonic Analysis. The window
will be similar to Figure 2.25. On the left side of the Harmonic Analysis screen,
choose the relay voltage and current channels to monitor for harmonic content.
Click the arrows of the Data Scroll box or the #Cycles box to change the data
analysis range.
Figure 2.22 Sample Event Oscillogram
Figure 2.23 Retrieving Event Report Waveforms
Figure 2.24 Sample Phasors Event Waveform Screen