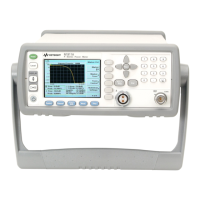
N1911A/1912A P-Series Power Meters Programming Guide 21
List of Figures
Figure 1-1 Frequency Dependent Offset Tables . . . . . . . . . . . . . .51
Figure 1-2 Typical Averaged Readings on 8480 Series Sensors .58
Figure 1-3 Averaging Range Hysteresis . . . . . . . . . . . . . . . . . . . .59
Figure 1-4 Limits Checking Application . . . . . . . . . . . . . . . . . . . . .63
Figure 1-5 Limits Checking Results . . . . . . . . . . . . . . . . . . . . . . . .64
Figure 1-6 How Measurement are Calculated . . . . . . . . . . . . . . .72
Figure 1-7 Generalized Status Register Model . . . . . . . . . . . . . . .74
Figure 1-8 Typical Status Register Bit Changes . . . . . . . . . . . . . .75
Figure 1-9 Status System . . . . . . . . . . . . . . . . . . . . . . . . . . . . . . .81
Figure 1-10 Hierarchical structure of SCPI . . . . . . . . . . . . . . . . . . .94
Figure 1-11 Format of <character_data> . . . . . . . . . . . . . . . . . . . .97
Figure 1-12 Format of <non-decimal numeric> . . . . . . . . . . . . . . .99
Figure 1-13 Format of <NR1> . . . . . . . . . . . . . . . . . . . . . . . . . . . .100
Figure 1-14 Format of <NR2> . . . . . . . . . . . . . . . . . . . . . . . . . . . .100
Figure 1-15 Format of <NR3> . . . . . . . . . . . . . . . . . . . . . . . . . . . .101
Figure 1-16 Format of <string> . . . . . . . . . . . . . . . . . . . . . . . . . . .102
Figure 2-1 Measurement Display CALCulate Block Window . . .112
Figure 3-1 Measurement Display CALCulate Block Window . . .176
Figure 3-2 CALCulate Block . . . . . . . . . . . . . . . . . . . . . . . . . . . . .177
Figure 10-1 Example of Averaged Readings . . . . . . . . . . . . . . . . .373
Figure 12-1 IEEE 488.2 Arbitrary Block Program Data Format . .522
Figure 12-2 A Trace Display Of The Active Timeslots . . . . . . . . . .580
Figure 16-1 Measurement Display UNIT Block Window . . . . . . . .728
Figure B-1 Example of VEE program used in measurement polling .
769

 Loading...