Note: If at any time you receive an error message Failed to connect to the unit, the
SecureSync Web UImay have timed out (see "Web UI Timeout" on page268).
Refresh your browser page to log back in.
To open the BroadShield user interface:
1.
Navigate to MONITORING > BroadShield. (If you cannot see the MONITORING button
in the Primary Navigation Bar of the HOMEscreen, this license is not present.)
2.
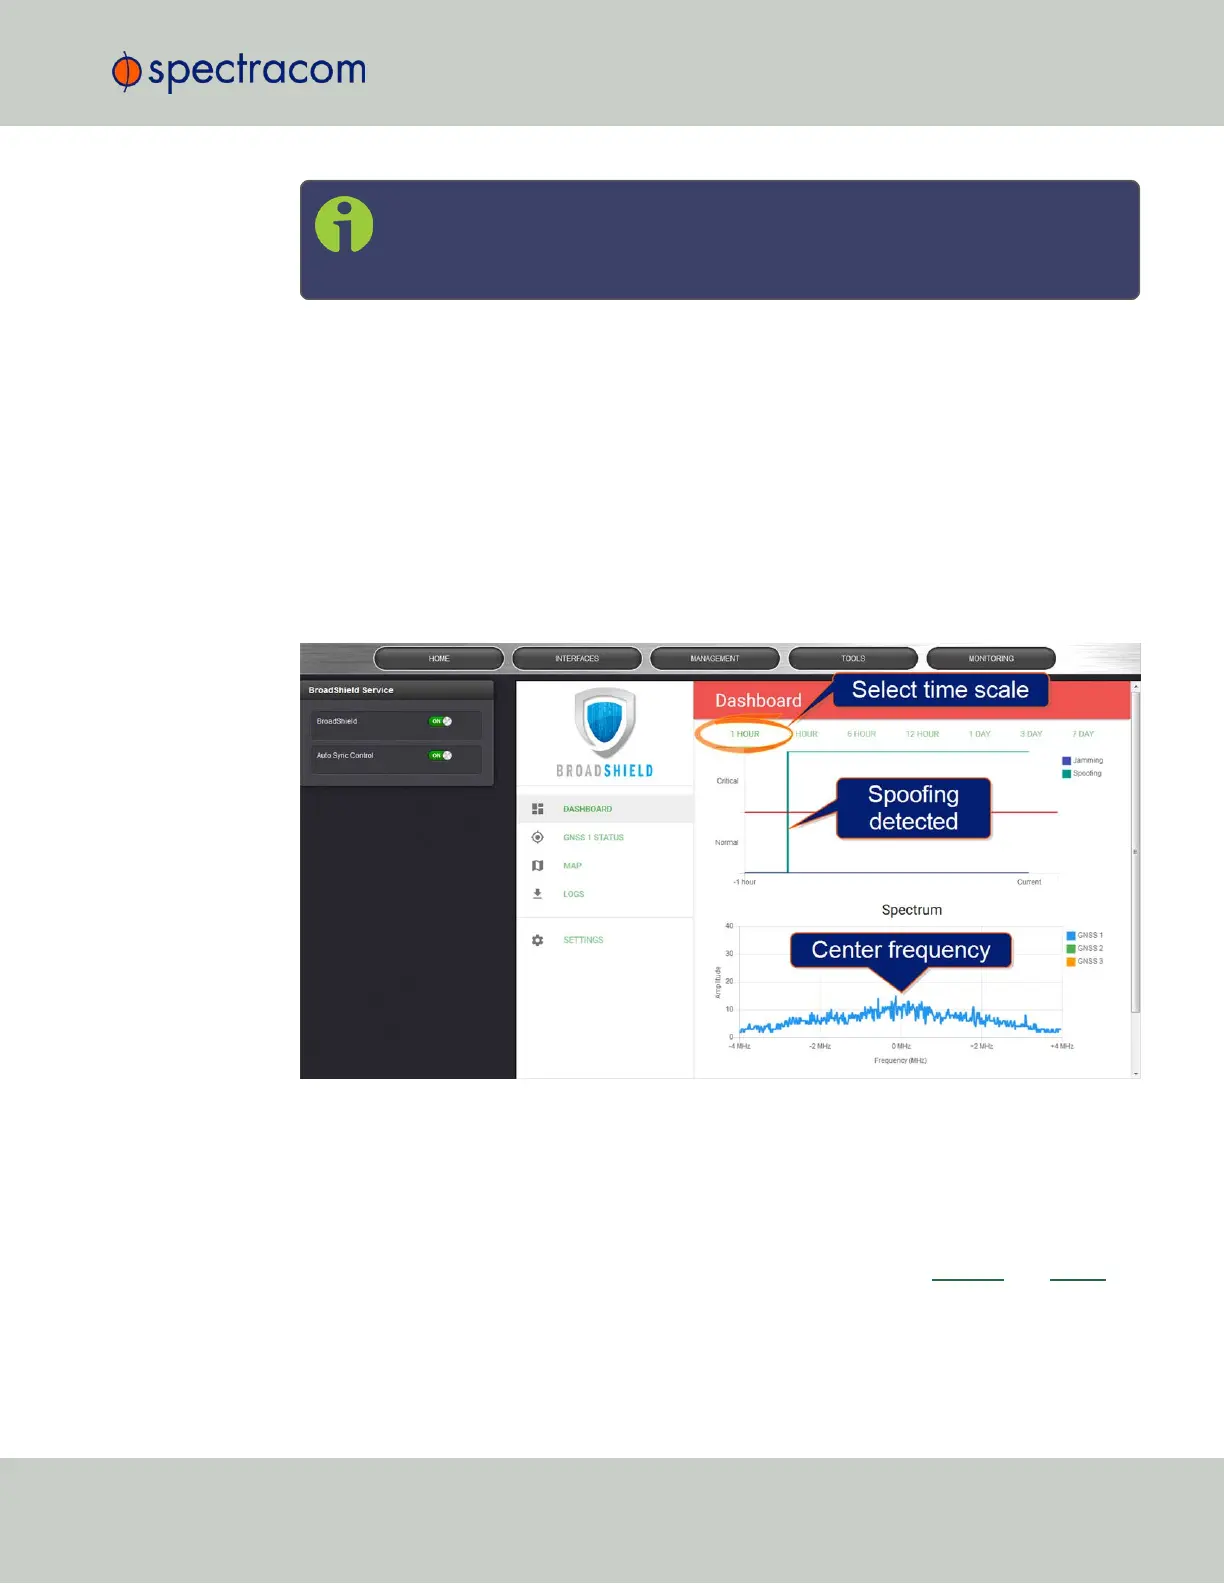
The embedded Broadshield Web UI will open, displaying the Dashboard and providing
access to the following panels:
DASHBOARD
The Dashboard panel displays up to 7 days of history data, and a real-time amplitude fre-
quency spectrum. The headline background color indicates the current jamming/spoofing
status: red= jamming or spoofing detected; green = no alarms at this time
Top graph
The Dashboard top graph displays the past signal level over time, divided into a Normal and a
Critical signal level (separated by a red line). A blue line in the Critical zone indicates a poten-
tial jamming incident, while a green line indicates that SecureSync may be subject to a spoof-
ing attack.
You can change the time scale by clicking on any of the labels between 1 HOUR and 7DAY.
3.3 Managing References
CHAPTER 3 • SecureSync User Reference Guide Rev. 26
179