The data displayed is linked to a specific Ethernet port e.g., ETH0. If you enable additional Eth-
ernet ports, their throughput data will also be displayed.
In the Traffic pane on the right the traffic throughput in Bytes per second is displayed in two
graphs. Drag the handles at the bottom of the graphs to zoom in on a particular time frame.
In the Actions panel on the left, you can clear or download monitoring data.
In the Status panel on the left, information pertaining to the given Ethernet port is displayed,
including throughput statistics and error statistics. The Mode field indicates which transmission
mode is being used for the given Ethernet port:
FULL duplex, or
HALF duplex.
Note that the Mode is auto-negotiated by SecureSync. It can be changed only via the switch
SecureSync is connected to, not by using the SecureSync WebUI.
4.5.1.6 Outputs Status Monitoring
Per standard configuration, SecureSync is equipped with one 1PPS and one 10 MHz output.
Additional outputs can be added by means of output option cards.
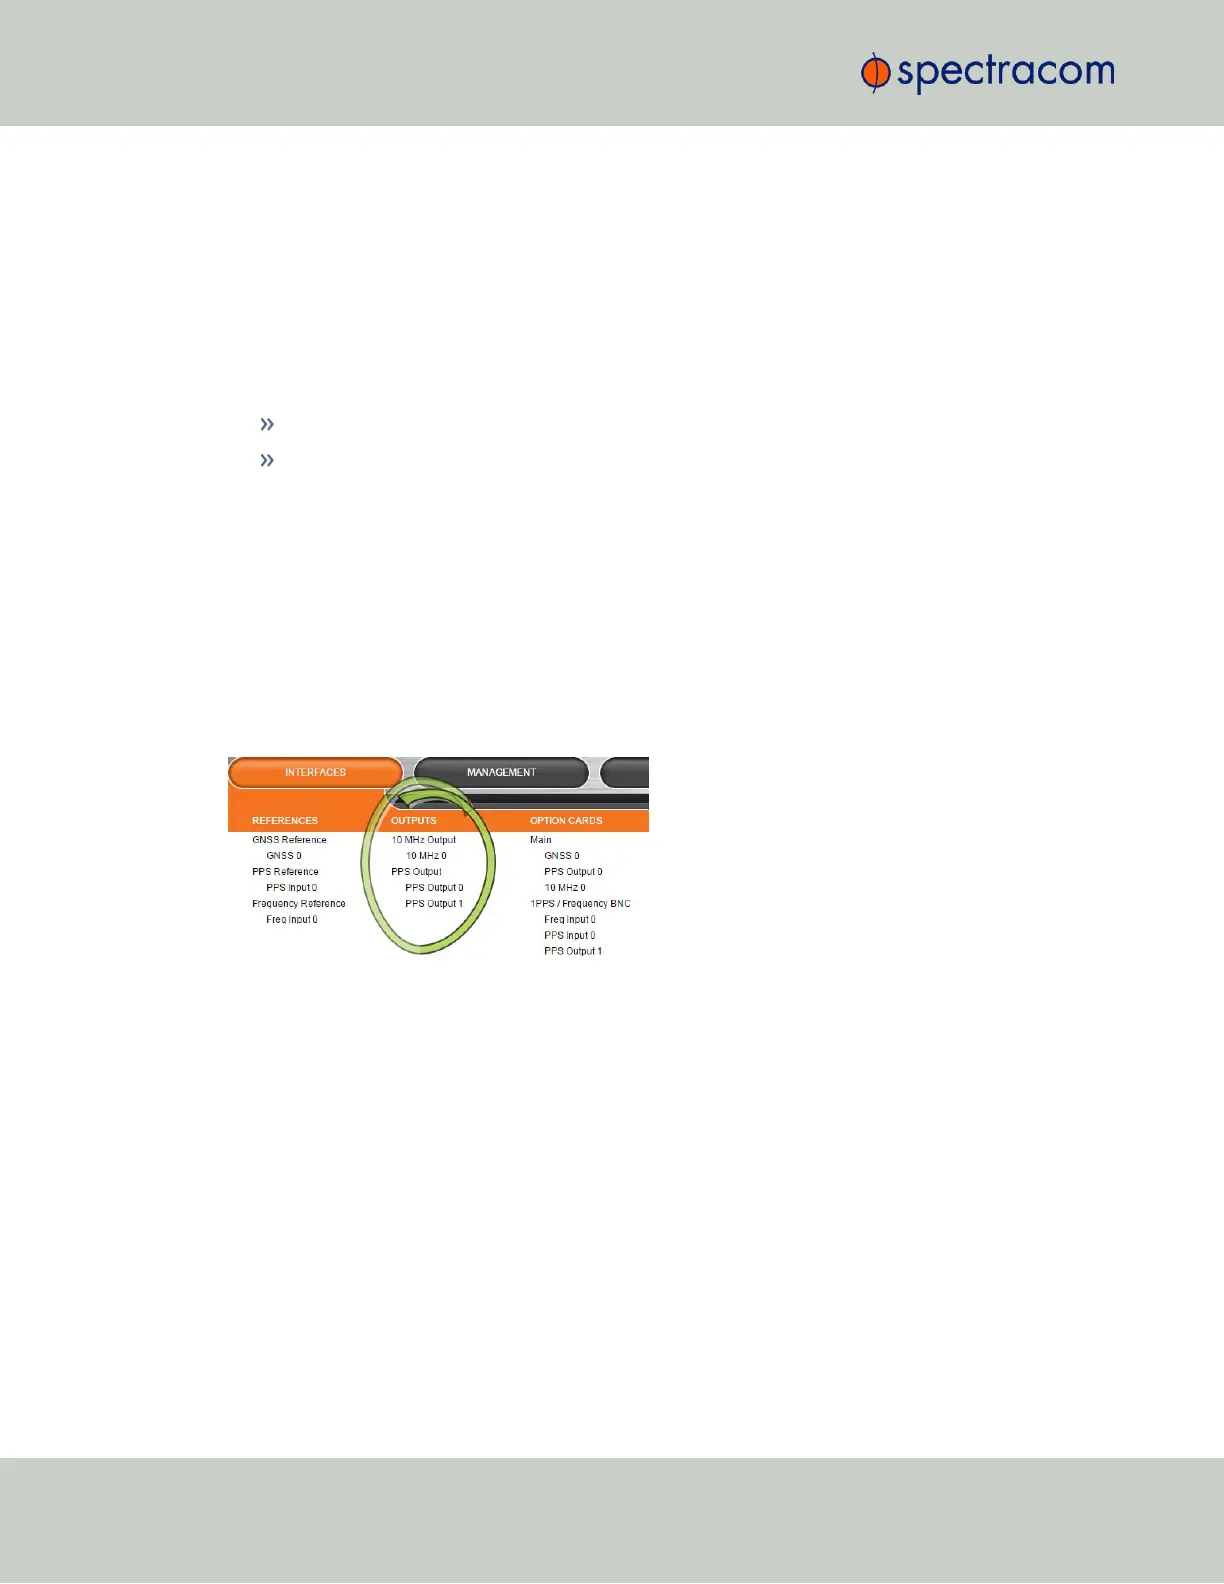
Outputs can be monitored in real time via the INTERFACES drop-down menu. The menu will
populate dynamically, depending on which outputs are installed.
Monitoring the status of all outputs
To display a list of all the outputs installed in a SecureSync unit:
284
CHAPTER 4 • SecureSync User Reference Guide Rev. 26
4.5 Quality Management