Note: A SecureSync reboot will reset all history data (it can still be retrieved via
LOGS.)
Bottom graph
The bottom graph labeled Spectrum visualizes the current signal over the GPS frequency band.
Unusual amplitude spikes indicate a potential threat. If your system is equipped with more than
one GNSSreceivers, a green and an orange graph will indicate the signal level for additional
receivers.
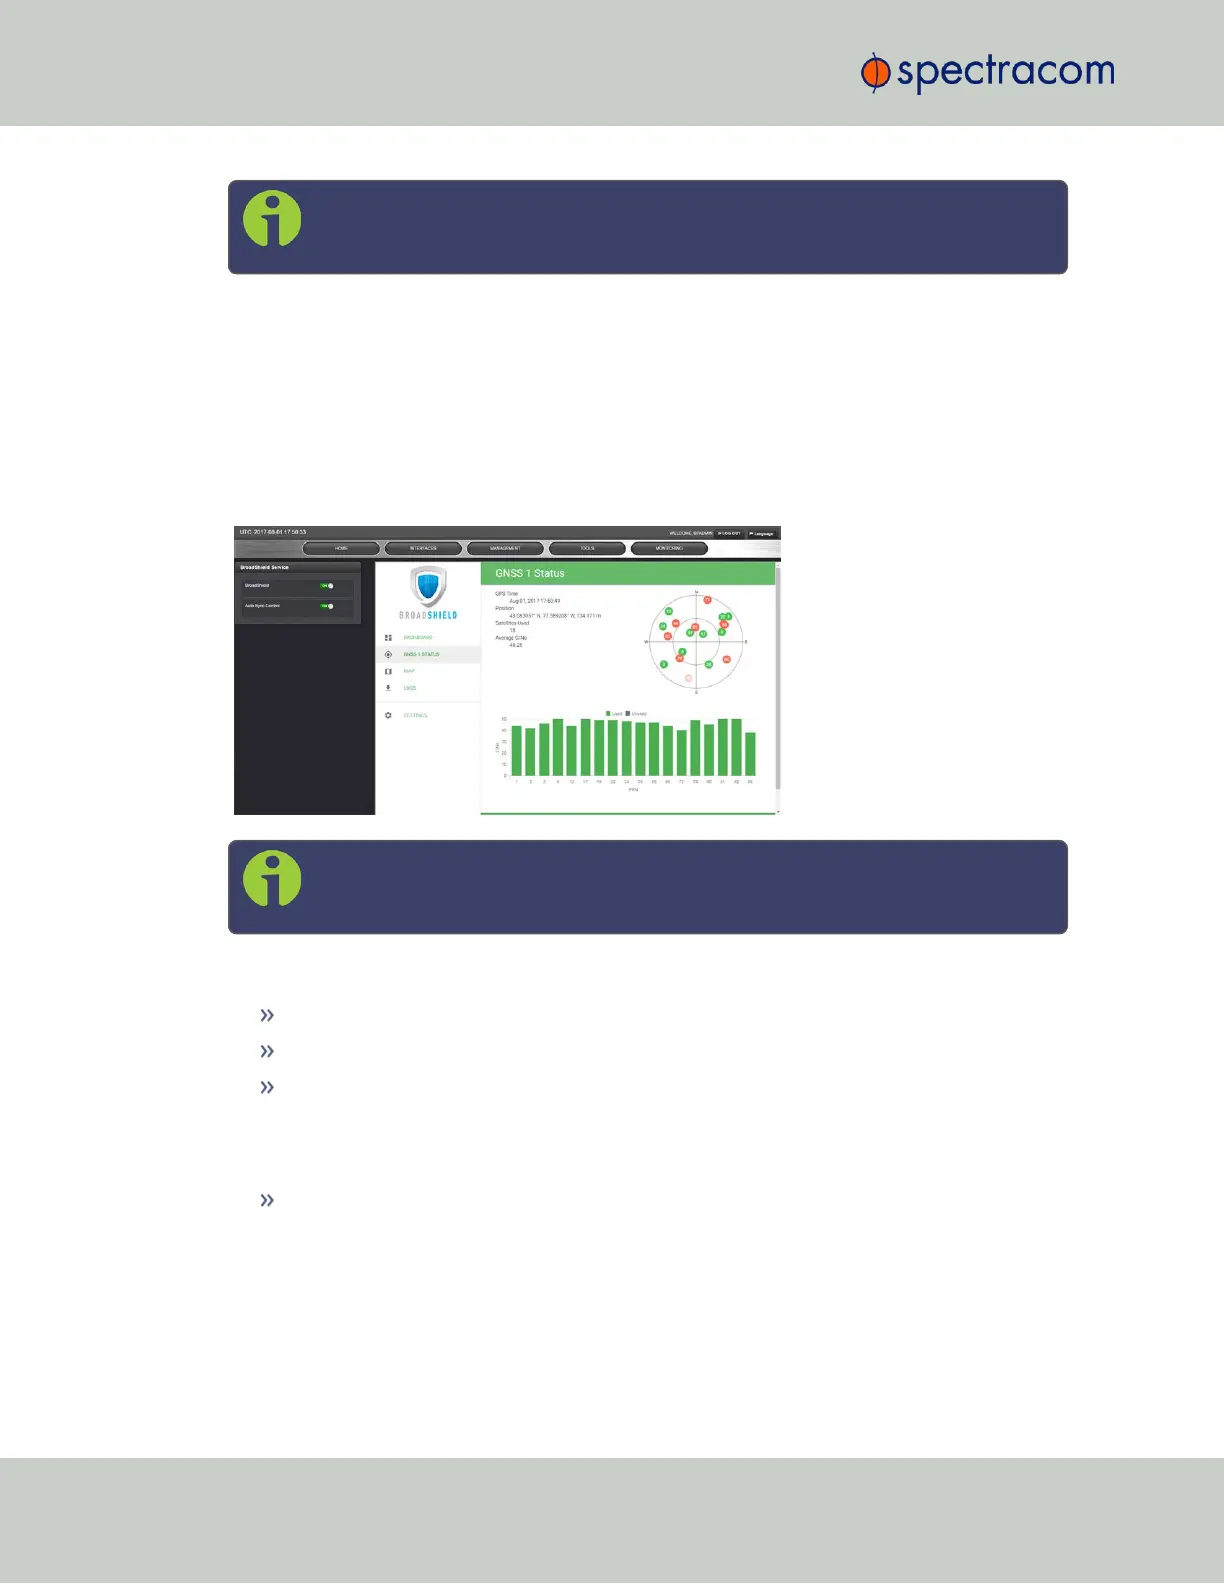
GNSS 1 Status
Note: The BroadShield GNSS1 reference refers to the SecureSync GNSS 0 ref-
erence.
Status information
GPS Time: Time and Day as provided by SecureSync's GNSS receiver.
Position: The position as determined by SecureSync's GNSS receiver.
Satellites Used: The number of satellites currently received by SecureSync. This number
includes all satellites currently received for all enabled constellations (see "Selecting
GNSS Constellations" on page201). Note that BroadShield uses only GPS signals for
jamming/spoofing detection.
Average C/No: Average signal to noise ratio. An average C/No value higher than 30
can be considered "good".
Skyplot graph
The center of the skyplot represents the antenna position. The skyplot shows all GPS satellites cur-
rently being tracked and – if enabled (under INTERFACES: REFERENCES > GNSS Reference:
GNSS 0 > Edit button > Selected Constellations) – will also display all GLONASS satellites
180
CHAPTER 3 • SecureSync User Reference Guide Rev. 26
3.3 Managing References