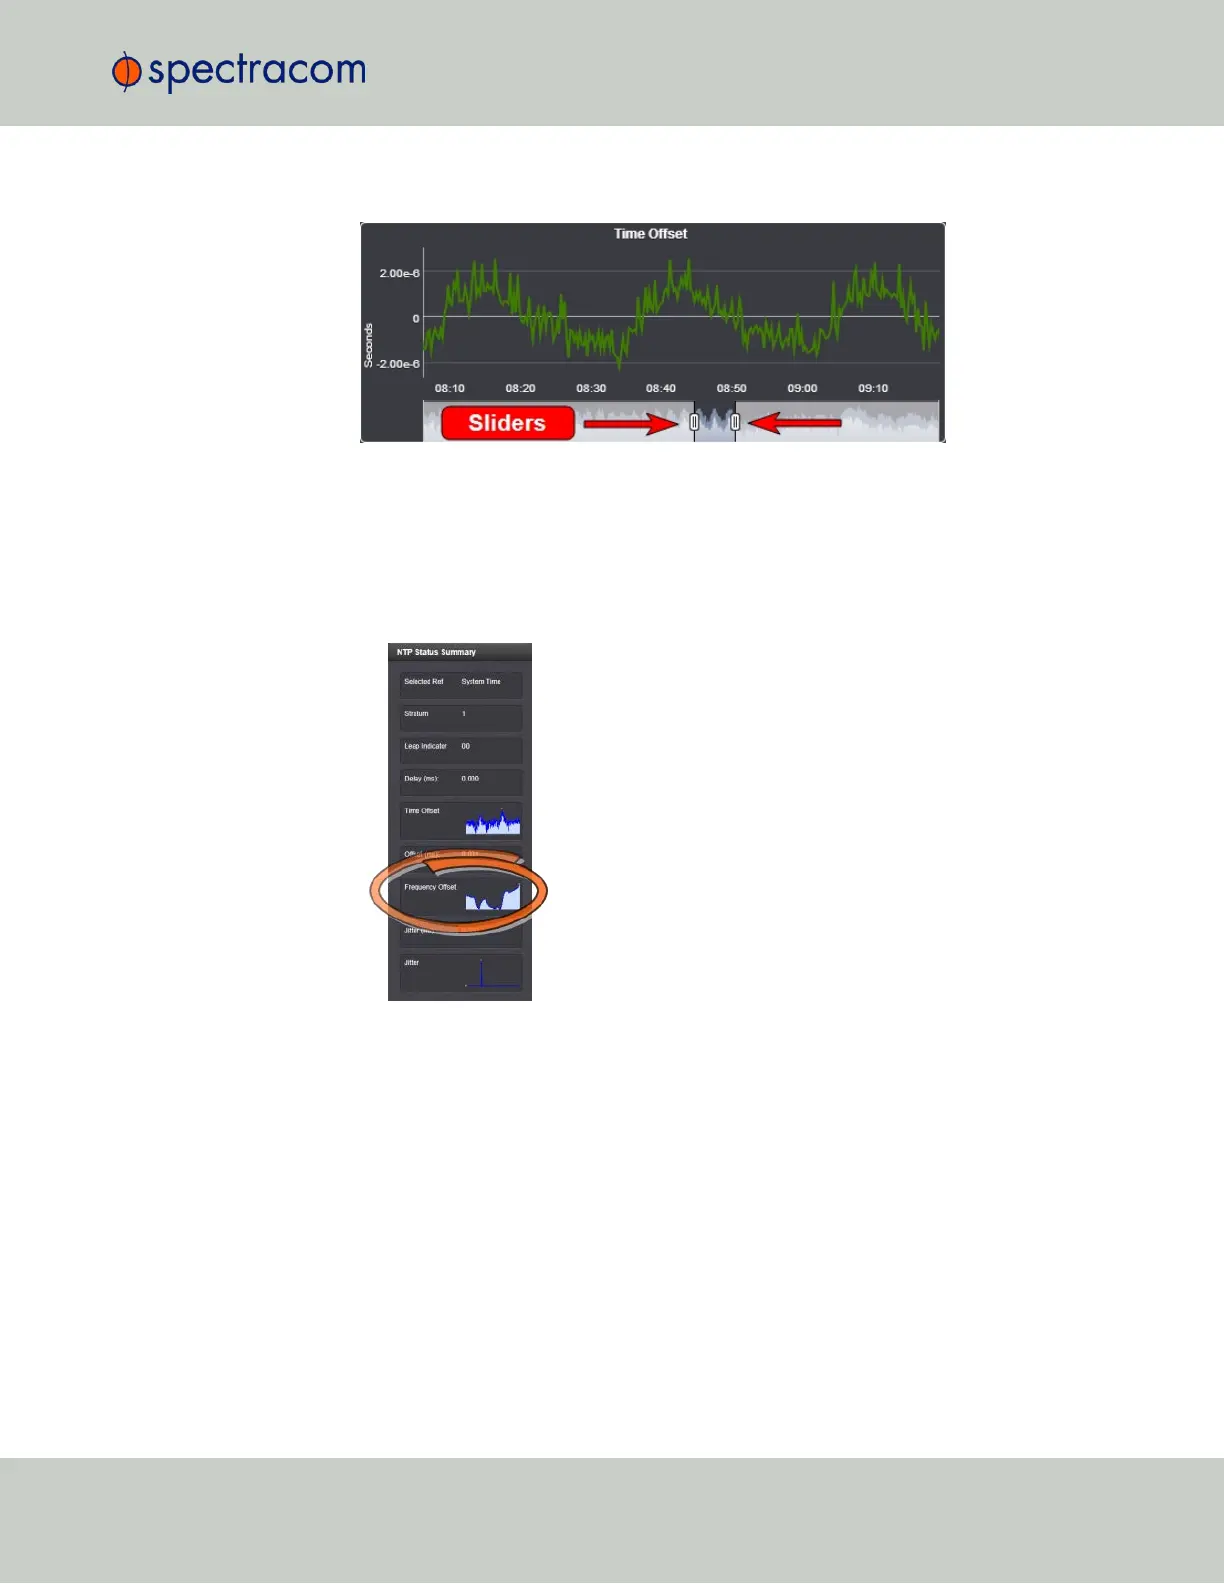
sliders at the bottom of the graph inwards.
The NTP Frequency Offset Performance Graph
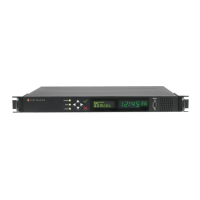
To view the NTP Frequency Offset performance graph:
1.
Navigate to MANAGEMENT > NETWORK: NTP Setup.
2.
In the NTP Status Summary panel locate the Frequency Offset graph.
3.
Click the graph in the NTP Status Summary panel.
4.
The NTP Performance Graph panel will appear (the data may be displayed with a
delay). The X-axis represents time, the Y-axis shows the frequency offset in parts-per-mil-
lion (PPM); e.g. 290PPM is equivalent to .0290percent.
4.5 Quality Management
CHAPTER 4 • SecureSync User Reference Guide Rev. 26
295