Applications
R&S
®
RTM3000
202User Manual 1335.9090.02 ─ 09
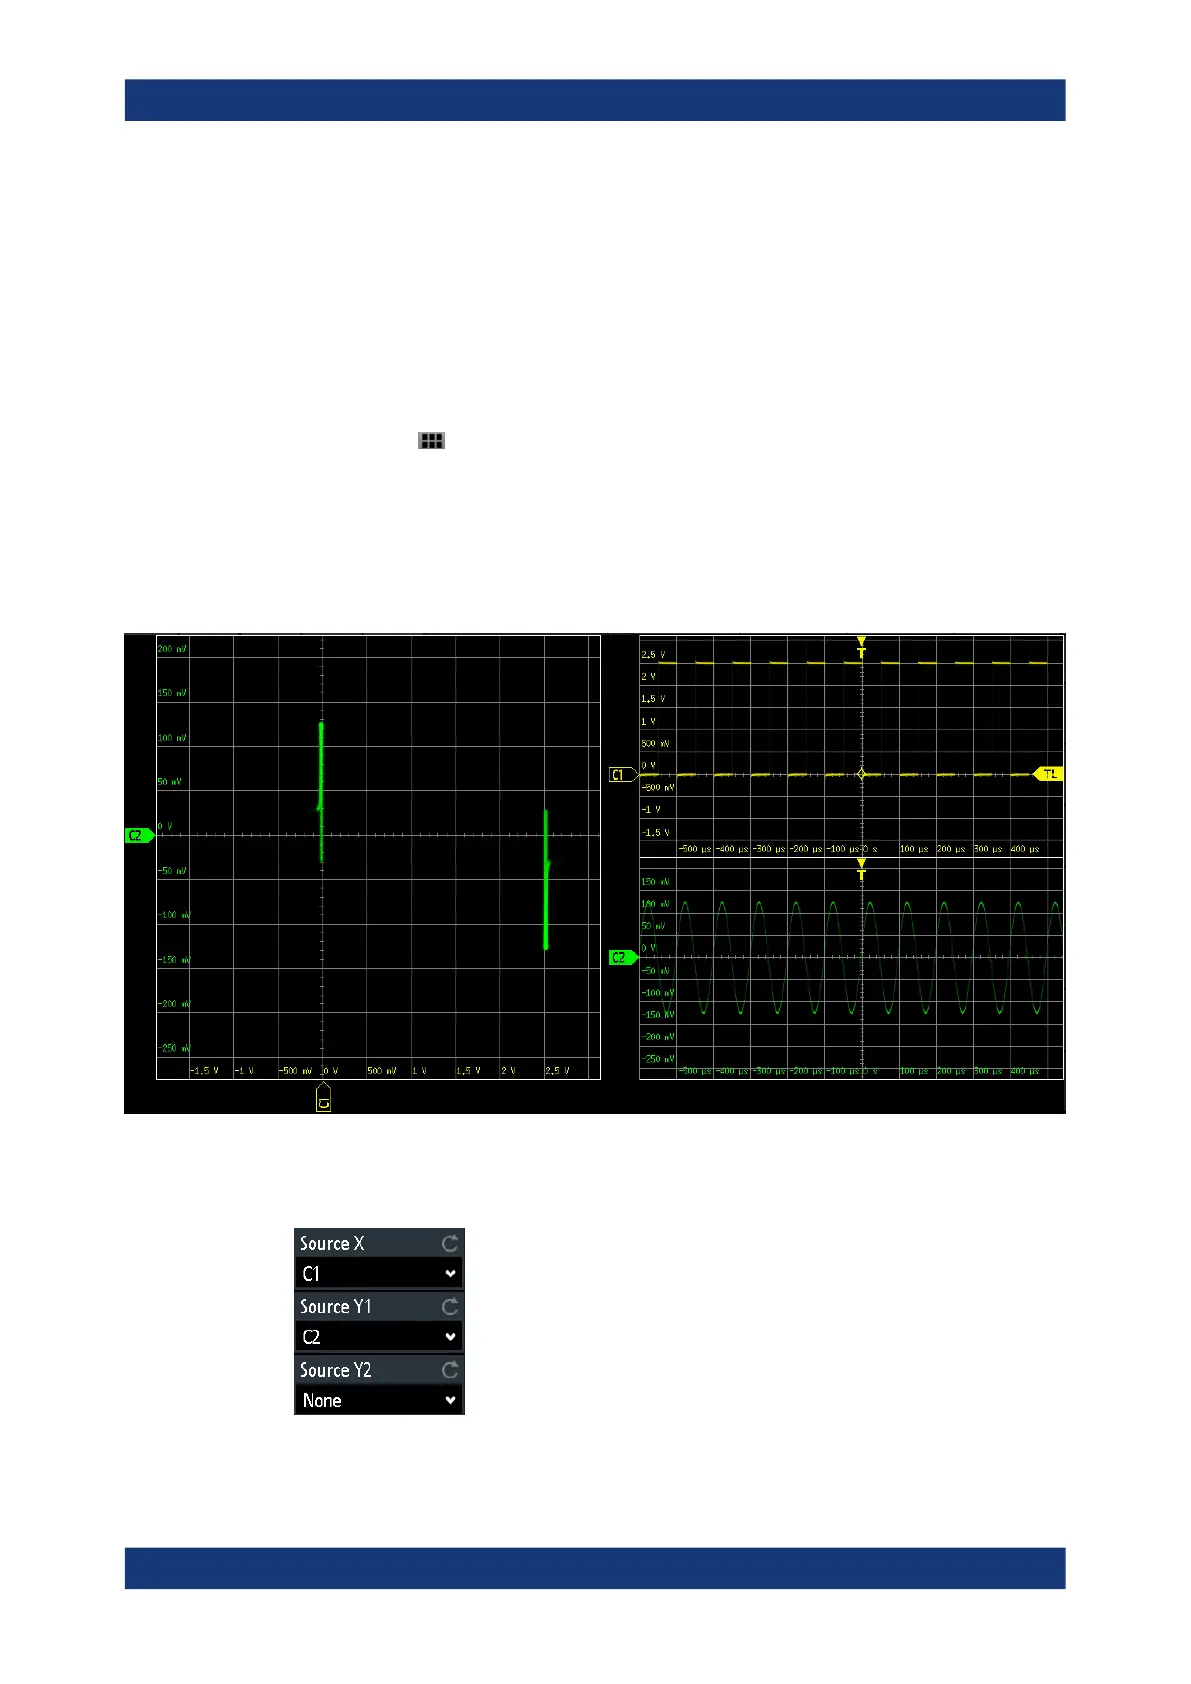
XY-diagrams are Lissajous patterns. XY-diagrams can also be used to display the IQ
representation of a signal.
Together with the XY-diagram, the time diagrams of the source signals are displayed in
separate grids. It is also possible to define two source signals in y-direction for compar-
ison.
The XY-diagram is provided in a dedicated application on the R&S RTM3000. If the XY-
application is active, reference waveforms are not available in all diagrams.
1.
Press the
[Apps Selection] key.
2. Select "XY".
3. Make sure that the signals, the trigger, and the acquisition are set up correctly. The
required menus are available in XY-mode.
Remote command: DISPlay:MODE on page 557
To analyze the signal in the XY-diagram, you can use cursor measurements. You can
select specific cursor measurement types:" Voltage X", "Voltage Y1", "Voltage Y2" use
2 cursor lines, "Voltage X-Y1" and "Voltage X-Y2" use 4 cursor lines.
XY-Diagram