Applications
R&S
®
RTM3000
183User Manual 1335.9090.02 ─ 09
Display
Opens a menu to set up the display of the spectrum and the spectrogram.
For details, see Chapter 9.3.4, "Display settings for spectrum and spectrogram",
on page 190.
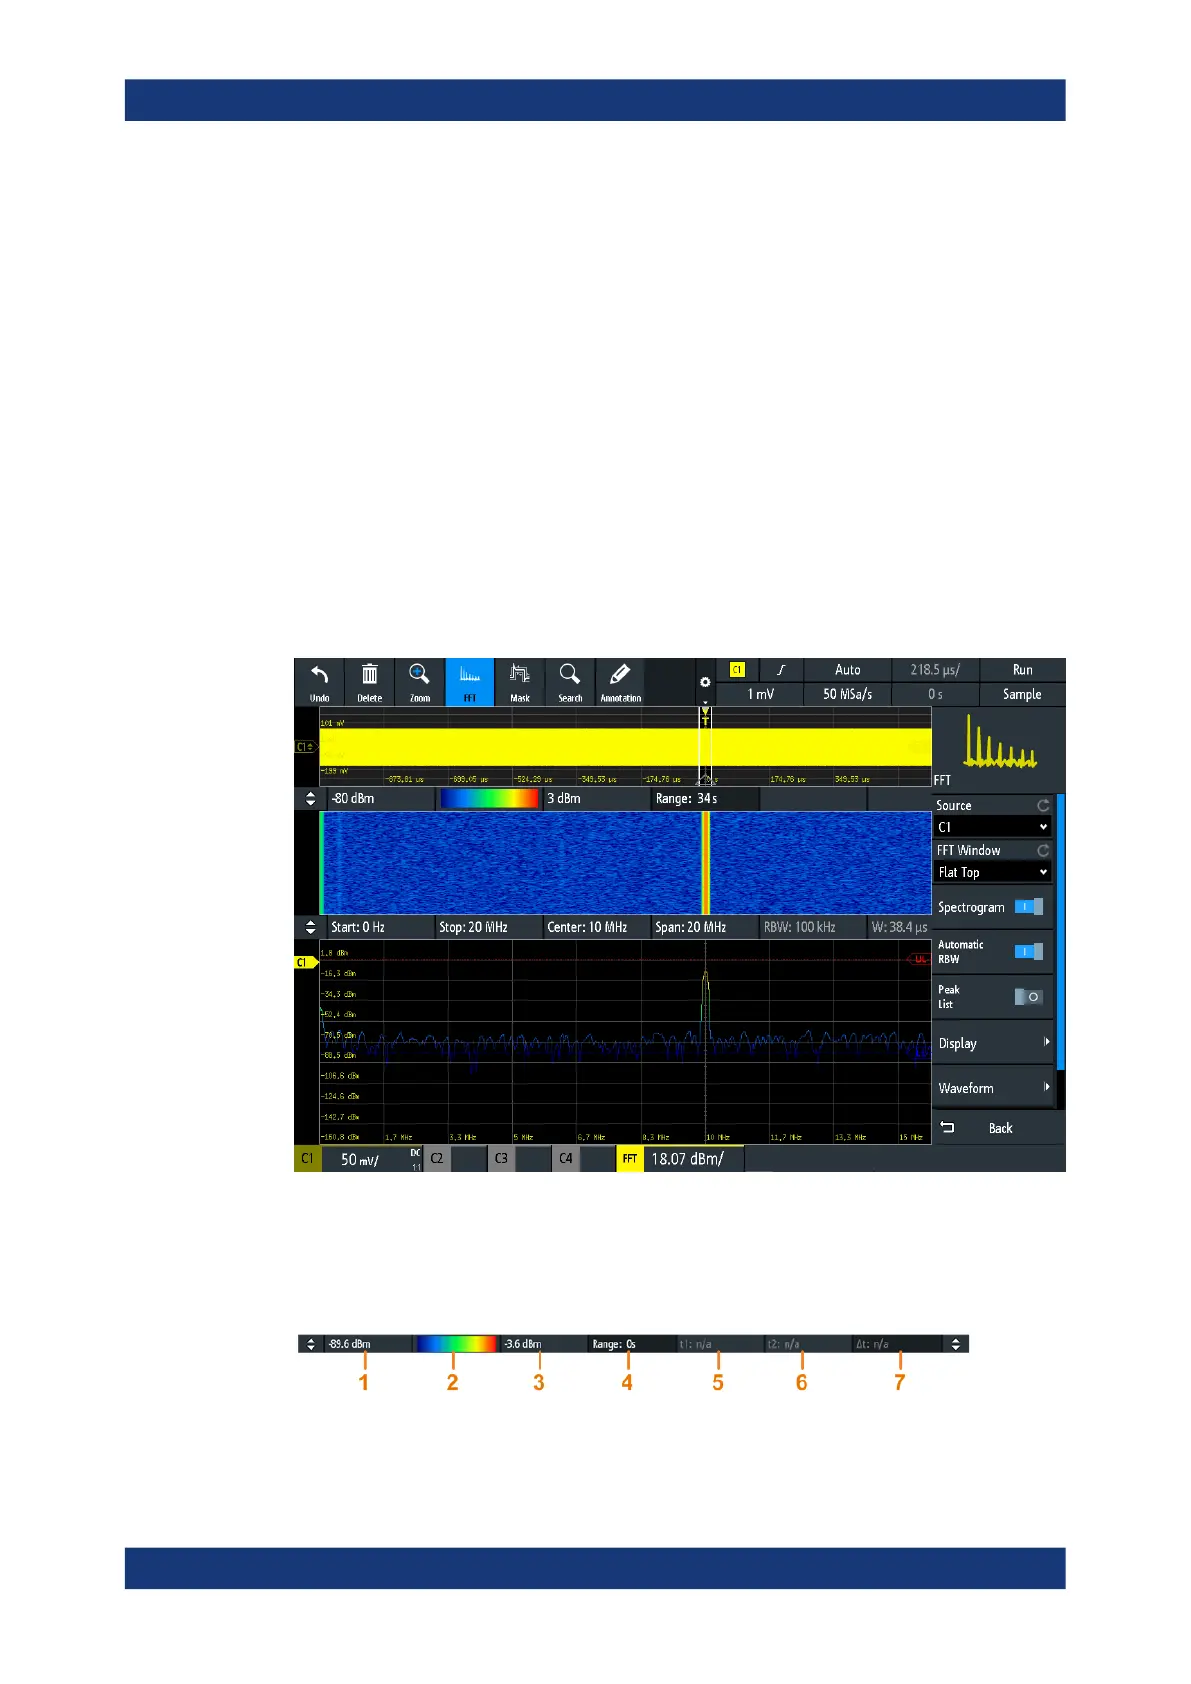
9.3.2 Spectrogram
A spectrogram shows how the spectral density of a signal varies over time. The x-axis
shows the frequency, the y-axis shows the time. A third dimension, the power level, is
indicated by different colors. Thus you can see how the strength of the signal varies
over time for different frequencies.
The spectrogram is updated with each data acquisition. The oldest spectrum is on the
top, while the most recent spectrum is the bottom line.
► To use the spectrogram, enable "Spectogram" in the FFT menu.
Figure 9-1: Spectrogram and spectrum windows
The spectrogram is shown in a separate window above the spectrum window. Typical
spectrogram parameters are shown directly in the spectrogram window, above the dia-
gram.
Spectrum analysis and spectrogram (option R&S
RTM-K18)