Applications
R&S
®
RTM3000
206User Manual 1335.9090.02 ─ 09
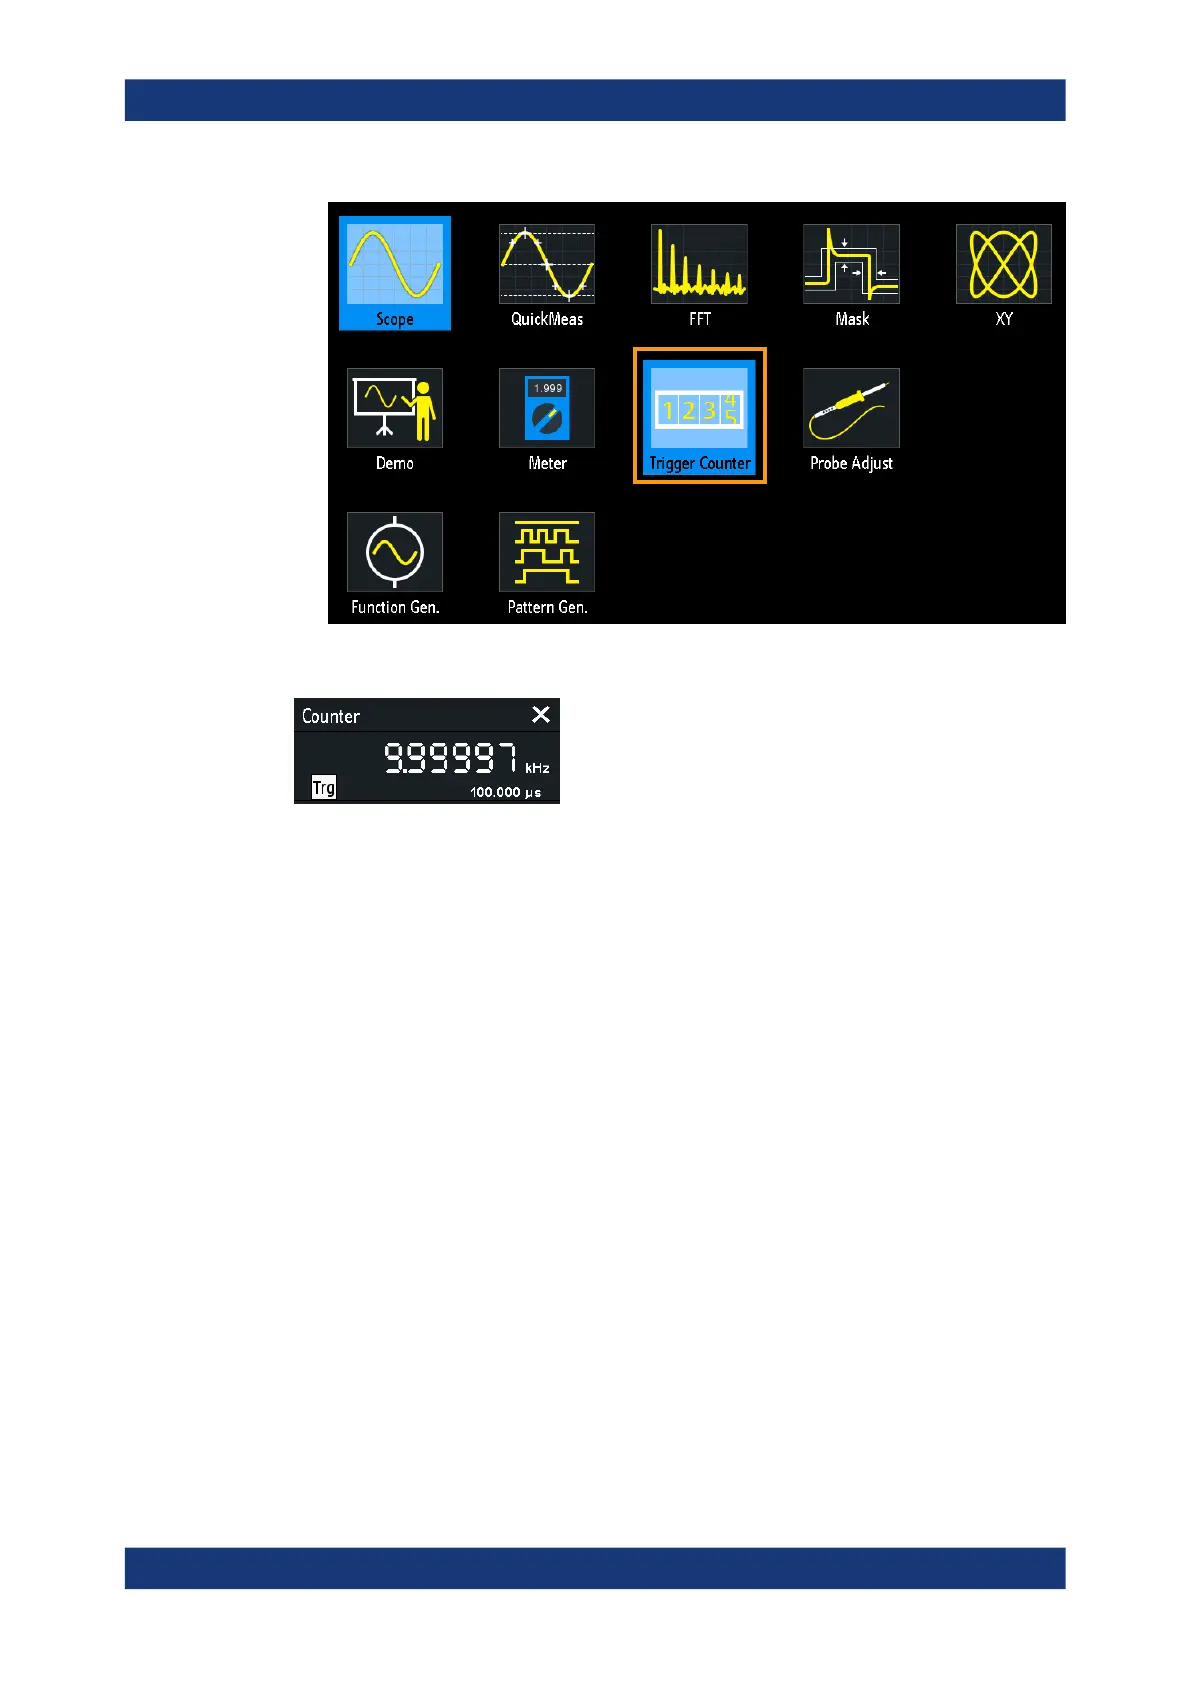
By default, the result box shows the frequency and period of the trigger source.
1. To toggle frequency and period results, tap inside the box.
2. To show the counter results of active waveforms, tap the source icon ("Trg") and
select a waveform.
3. To move the result box to the best position, can drag the box on the screen.
Remote commands:
●
TCOunter:ENABle on page 560
●
TCOunter:SOURce on page 561
●
TCOunter:RESult[:ACTual]:FREQuency? on page 561
●
TCOunter:RESult[:ACTual]:PERiod? on page 561
9.8 Bode plot (option R&S RTM-K36)
A Bode plot displays the frequency response of an electrical system. It is divided in two
parts, a magnitude plot and a phase shift plot.
Bode plot (option R&S
RTM-K36)