Applications
R&S
®
RTM3000
207User Manual 1335.9090.02 ─ 09
9.8.1 About the bode plot
Bode plot display
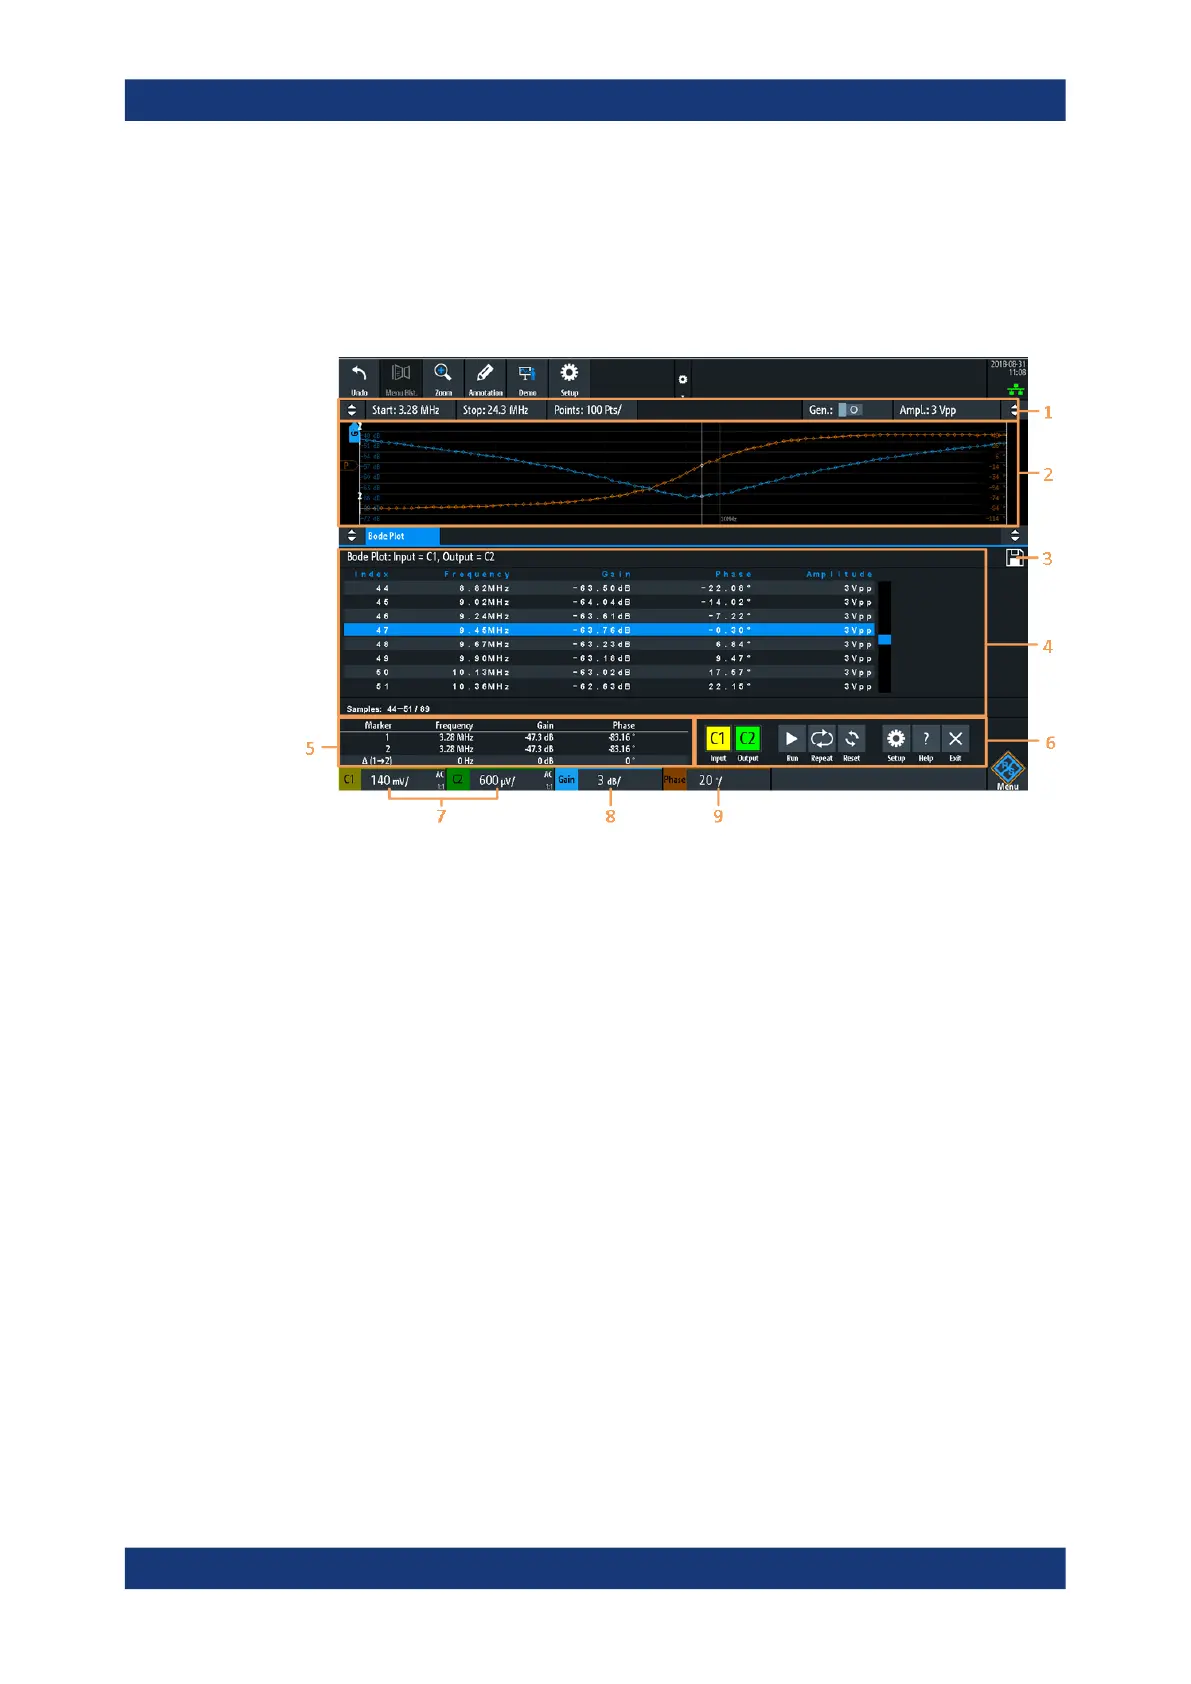
The Bode plot display is divided into several sections, see fig. 9-8.
Figure 9-8: Bode plot display
1 = Bode plot parameters
2 = Bode plot diagram, gain: blue color; phase: orange color
3 = Save
4 = Bode result table
5 = Marker value table
6 = Bode plot window controls
7 = Vertical settings of active analog channels
8 = Vertical settings of gain waveform
9 = Vertical settings of phase waveform
Bode plot diagram
The Bode plot diagram has the frequency presented on the x-axis. The gain (blue color
waveform) and phase (orange color waveform) scales are on the y-axis. The magni-
tude plot represents the gain of a system between input and output. The phase plot
shows the phase shift between input and output.
Bode plot result table
In the Bode plot result table, all sample points are displayed with the respective value
for the frequency, gain, phase and amplitude. If you select a sample in the table, the
respective points in the Bode plot are highlighted by a white line on the gain and the
phase curve.
Bode plot (option R&S
RTM-K36)