Applications
R&S
®
RTM3000
212User Manual 1335.9090.02 ─ 09
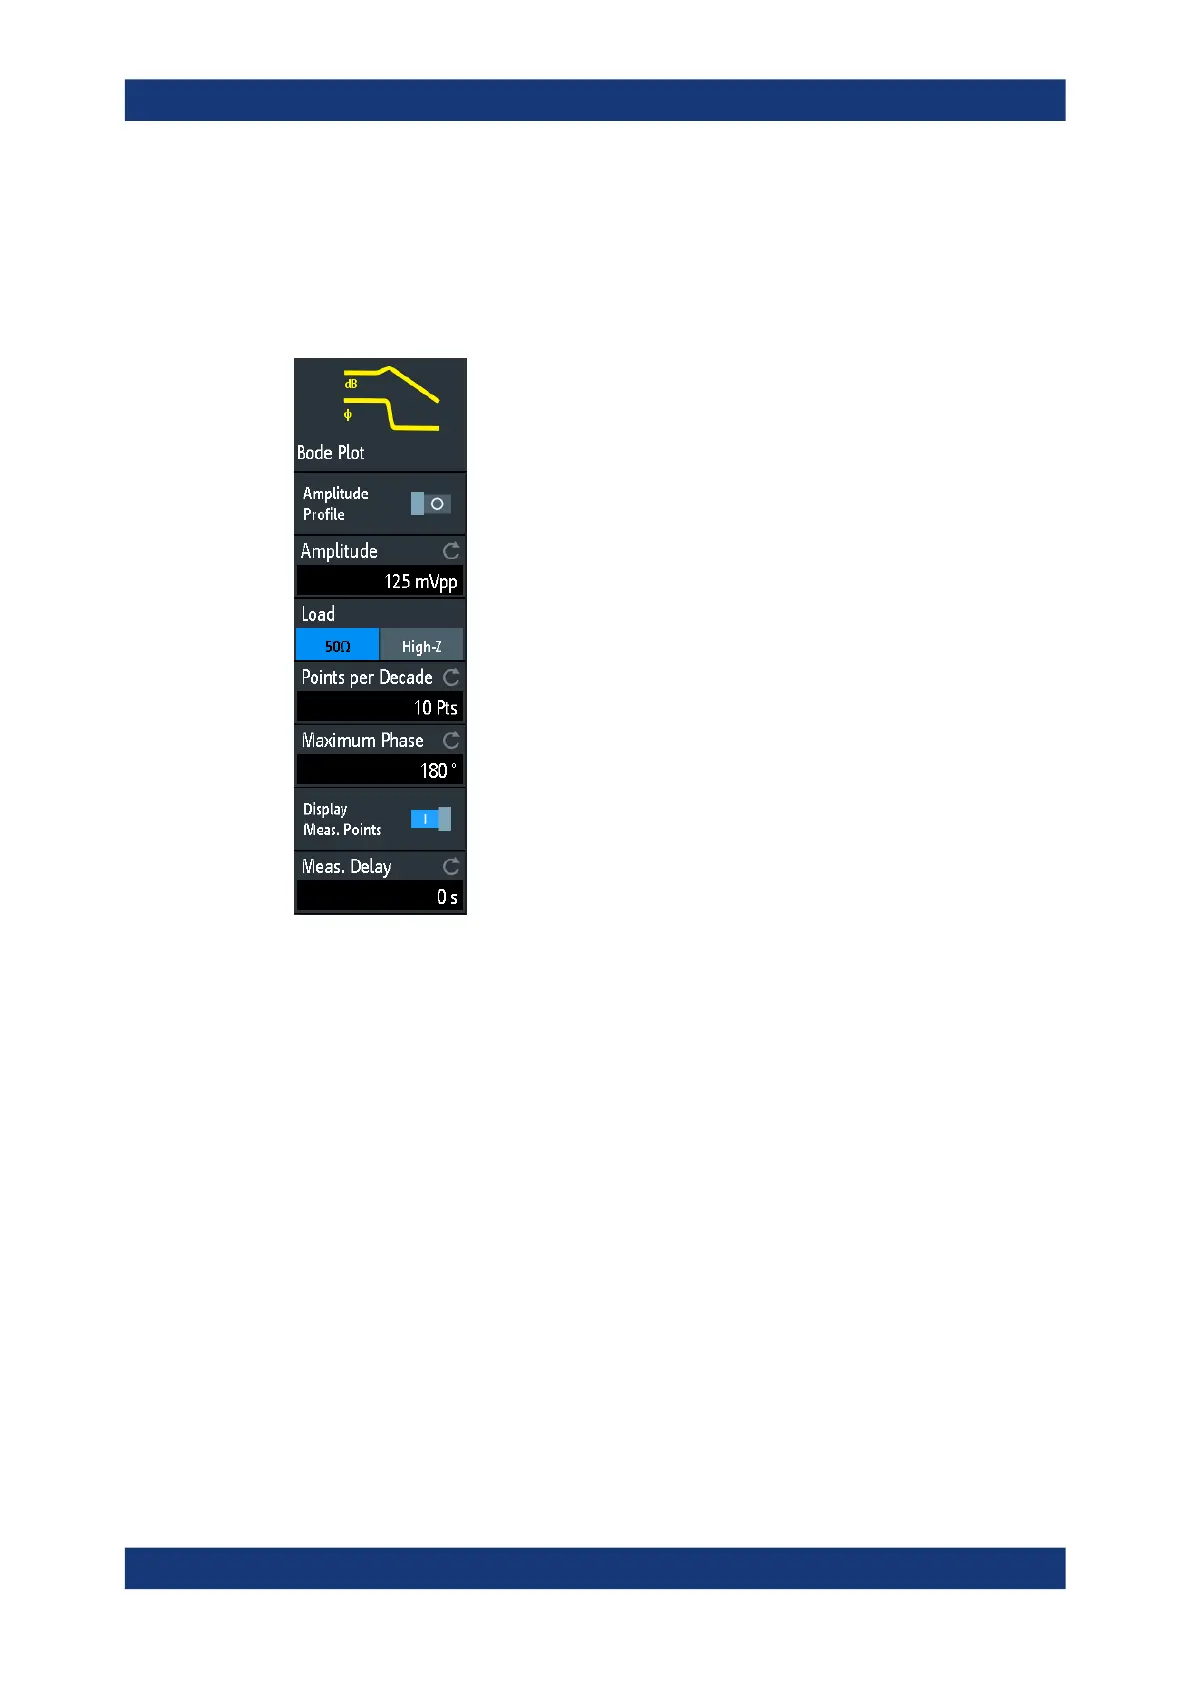
9.8.4 Bode plot settings
► To open the "Bode Plot" configuration menu, tap the "Setup" icon inside the "Bode
Plot" result box.
Amplitude Profile
Enables the amplitude profile. You can then define different amplitudes for different fre-
quency in the "Configuration" dialog. This is useful when testing sensitive circuits,
where the amplitude gets too high. In this case distortion might occur.
If this function is enabled, a diagram of the amplitudes for the different frequencies can
be displayed on the screen. To do that, press at the bottom of the Bode plot window.
You can configure the value curve through the touchscreen.
Bode plot (option R&S RTM-K36)
 Loading...