Applications
R&S
®
RTM3000
201User Manual 1335.9090.02 ─ 09
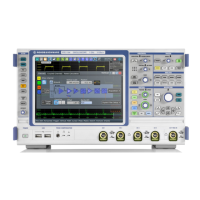
"Temp. Color"
The waveform is displayed in the temperature colors. Blue corre-
sponds to the low-level values while white indicates high ones.
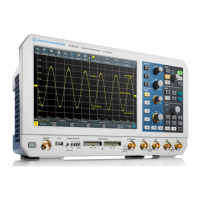
"Monochrome"
The waveform is displayed in monochrome colors, which depend on
the color of the selected source channel. Black corresponds to the
low-level values while the channel color indicates for high ones.
Remote command:
SPECtrum:DIAGram:COLor:SCHeme:SPECtrogram on page 557
SPECtrum:DIAGram:COLor:SCHeme:FDOMain on page 557
Magnitude Mode
Enables the magnitude-dependent coloring of the waveform. The higher the level, the
higher the color in the color scale.
When the "Magnitude Mode" is disabled, then the color depends on the frequency of
occurrence of a value.
Remote command:
SPECtrum:DIAGram:COLor:MAGNitude:MODE on page 556
Find Threshold
Sets the level automatically to 0.5 * (MaxPeak – MinPeak). The MinPeak is set in the
noise floor and the MaxPeak is the highest point of the waveform.
Maximum
Sets the level that is used as a maximum for the color scale selected with Spectr. Color
and Freq.Dom.Color.
All level values higher than the maximum are displayed with the maximum color.
Remote command:
SPECtrum:DIAGram:COLor:MAXimum[:LEVel] on page 556
Minimum
Sets the level that is used as a minimum of the color scale selected with Spectr. Color
and Freq.Dom.Color.
All level values lower than the minimum are displayed with the minimum color.
Remote command:
SPECtrum:DIAGram:COLor:MINimum[:LEVel] on page 557
9.5 XY-Diagram
XY-diagrams combine the voltage levels of two waveforms in one diagram. They use
the amplitude of a second waveform as the x-axis, rather than a timebase. Thus, you
can measure phase shift, for example. With harmonically related signals, the resulting
XY-Diagram