Waveform analysis
R&S
®
RTM3000
111User Manual 1335.9090.02 ─ 09
cycle of pulse width modulated waveforms (PWM) and pulse density modulated wave-
forms (PDM). Math tracks are independent of the measurement functions.
Tracks are used, for example, in power analysis, or for analysis of motor controls,
which use PWM signals to control speed. PDM signals are used, for example, for
model flight control.
Bipolar signals have negative and positive pulses. Bipolar PWM signals are used, for
example, to change the direction of the motor, and can be measured using differential
probes.
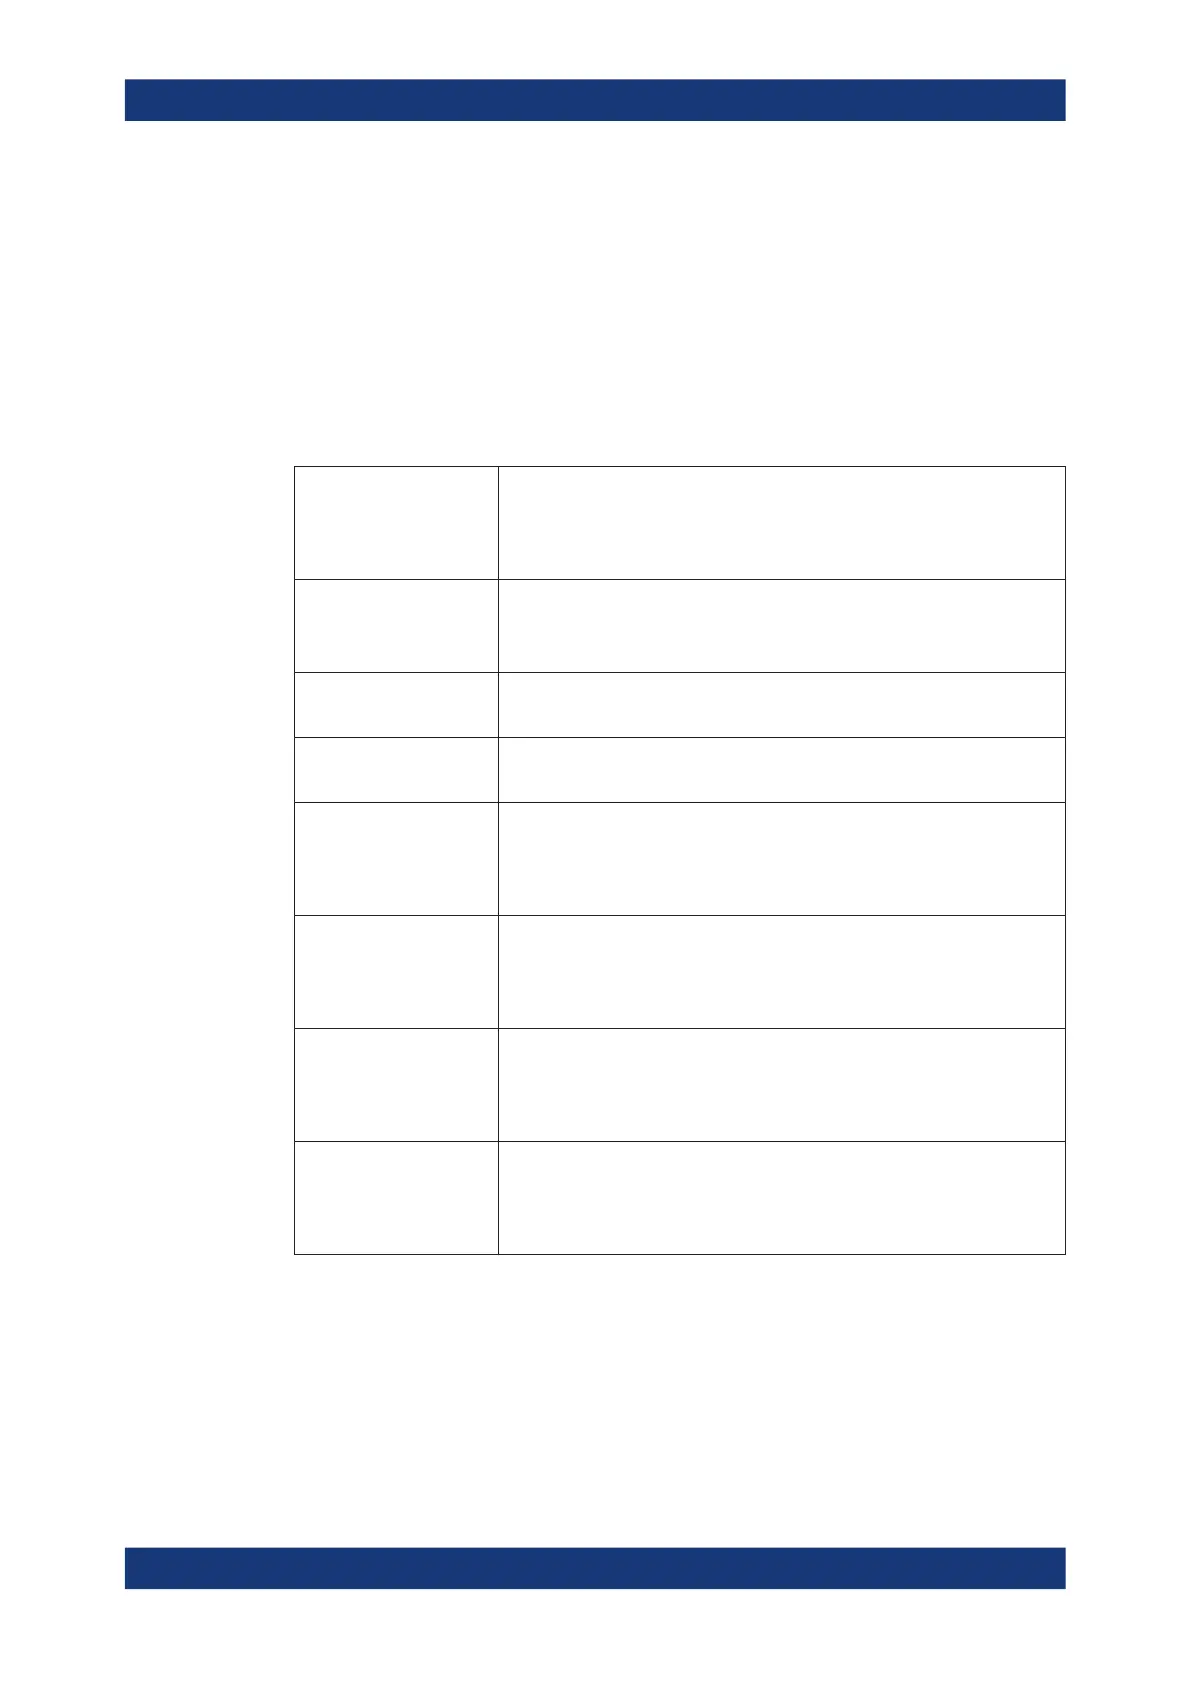
Table 7-2: Available track waveforms
Track period TPER(Source) in s
Tracks the period values of the source waveform, the time between the cross-
ing points of two subsequent on or off edges with the threshold.
See Figure 7-7.
Track period (bipolar) TPERB(Source) in s
Tracks the period values of a bipolar source waveform.
See Figure 7-6.
Track frequency TFREQ(Source) in Hz
Tracks the frequency values of the source waveform.
Track frequency (bipolar) TFREQB(Source) in Hz
Tracks the frequency values of a bipolar source waveform.
Track pulse width TPW(Source) in s
Tracks the pulse width of the source waveform. For a PWM source signal, the
result is the demodulated waveform.
See Figure 7-5.
Track pulse width (bipolar) TPWB(Source) in s
Tracks the pulse width of a bipolar source waveform. For a PWM source sig-
nal, the result is the demodulated waveform.
See Figure 7-8.
Track duty cycle TDCY(Source) in %
Tracks the duty cycle of the source waveform. For a PWM source signal, the
result is the demodulated waveform.
See Figure 7-4.
Track duty cycle (bipolar) TDCYB(Source) in %
Tracks the duty cycle of a bipolar source waveform. For a PWM source signal,
the result is the demodulated waveform.
See Figure 7-6.
Mathematics
 Loading...


