Power analysis (option R&S RTM-K31)
R&S
®
RTM3000
379User Manual 1335.9090.02 ─ 09
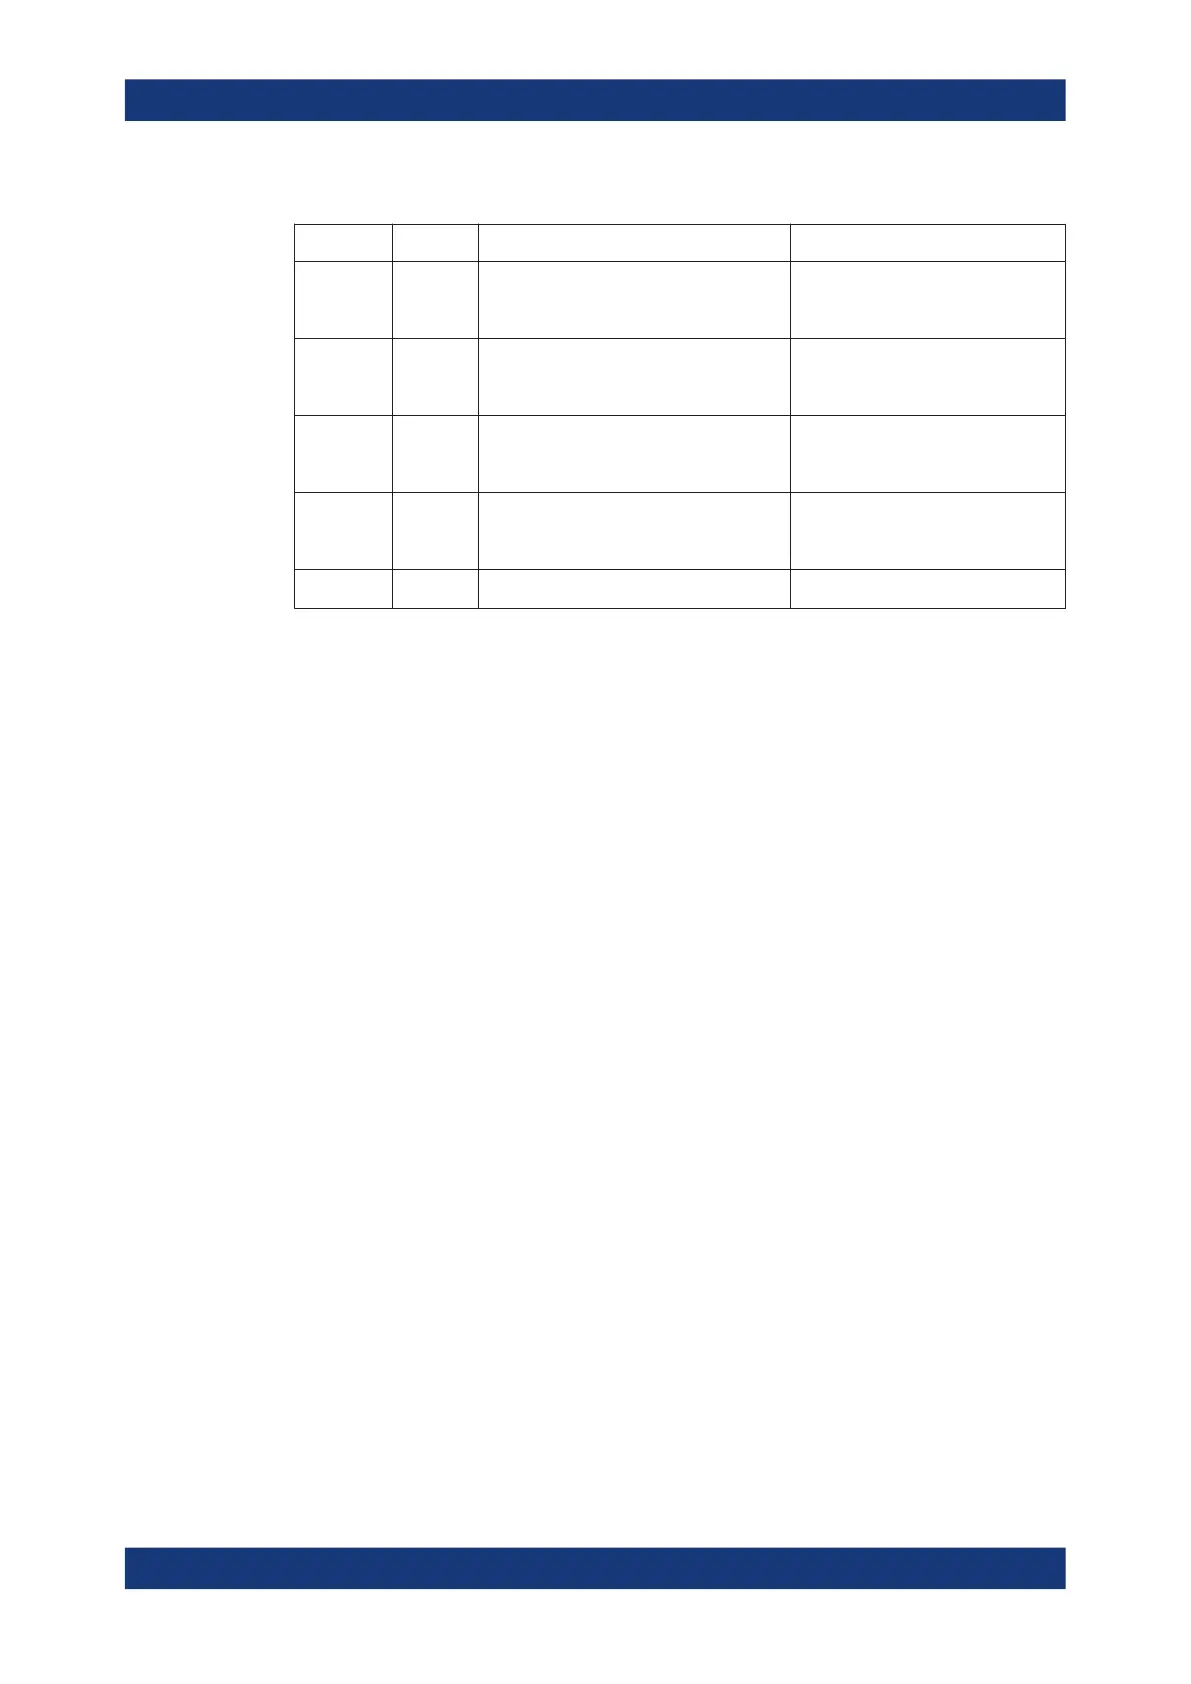
Table 14-5: Switching loss phases
Phase Symbol Definition Points Description
Turn on On The area between "t
1
" and "t
2
" The time after switching the device,
during which the current rises until it
reaches the saturation current level.
Conduction Cond The area between "t
2
" and "t
3
" The time during which the voltage is
at the transistors saturated minimum
and the current flows.
Turn off Off The area between "t
3
" and "t
4
" The time during which after a short
delay time the voltage rises until it
reaches its final value.
Non con-
duction
No Cond The area between "t
4
" and "t
5
" The time during current does not
flow. The losses during this period
should be theoretically zero.
Total Total The area between "t
1
" and "t
5
" The period of one switching cycle.
Remote commands are described in Chapter 17.12.16, "Switching", on page 761.
14.7.2.2 Configuring switching loss measurements
For details of the configuration settings, see Chapter 14.7.2.3, "Switching loss set-
tings", on page 380.
1. Press the Apps Selection key. Tap "Power Analysis".
2. In the "Power Path" tab, tap "Switching Loss".
3. Connect the differential voltage probe and the current probe to the oscilloscope.
It is recommended that you use a high-voltage differential probe for measurements
at the DUT power input.
4. Demagnetize the current probe. For details, see the user manual of your current
probe.
5. Select the "Tools" tab.
6. Connect the probes to the R&S RT-ZF20 power deskew fixture.
7. "Deskew" the probes and adjust the "Zero Offset".
8. Disconnect the probes from the R&S RT-ZF20 power deskew fixture.
9. Connect the probes to the DUT:
● Connect the positive (+) signal socket of the differential probe to the drain of
the transistor.
● Connect the negative (-) signal socket of the differential probe to the source of
the transistor.
● Connect the current probe to the source of the transistor.
10. Close the "Power Analysis".
Power path power measurements
 Loading...


