FuelsManager Defense
178 Administrator Manual
Note! The default font attributes
also apply to the Value object.
Creating a Value involves selecting a point (for example, Tank 10 from Tank Farm
20), a point parameter (i.e. temperature, tank level), and a system database
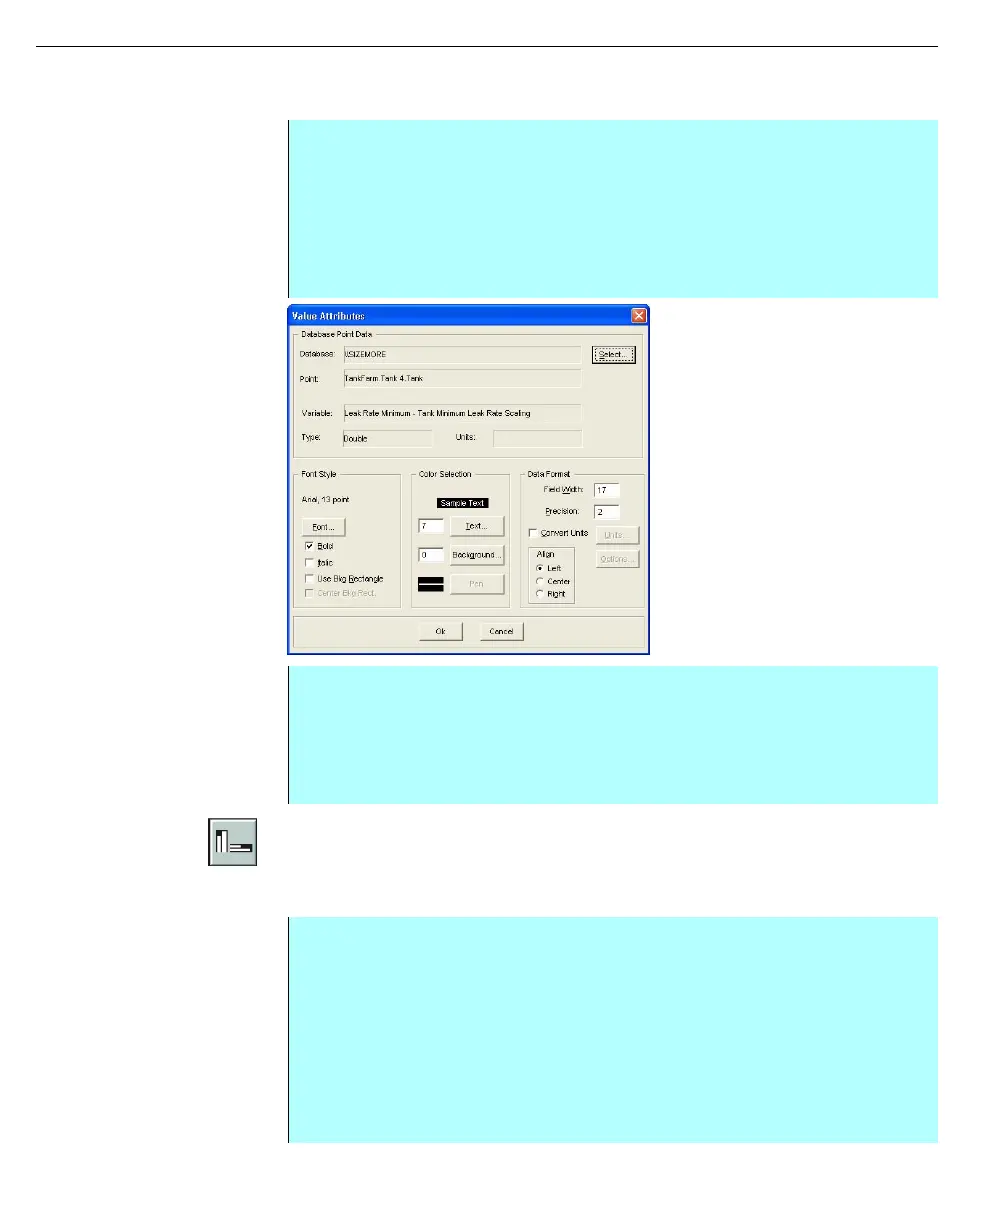
Value Attributes dialog
box
Inserting a bar graph
The Bar tool is used to draw vertical, horizontal or deviation bar graphs based on a
numerical point’s range.
Step-by-Step
• Select the Value tool (or select Add and click Value)
• Click on area where the value will be inserted
• Select a point to define from the Database Edit dialog box to be represented
by the value. Click Select. The Select Database Point dialog box appears
• The Select Database Point dialog box confirms the variable selection. If the
selection is incorrect select the appropriate button to edit the selection
• Click OK to save the value
• The Value Attributes dialog box appears
• Set the value appearance, formatting and the positioning of the value
• Once complete, click OK
• The value appears in the selected area
Step-by-Step
• Select the Bar tool (or select Add and click Bar). Click on area to define the
corner and hold down the mouse button.
• Drag the cursor to end position and release the mouse button.
• Select the appropriate database, point, and corresponding variable by
clicking the Database, Point or Variable buttons.
• Click OK. The Dynamic Bar Attributes dialog box appears.
• Edit the data source, or define the attributes of the bar graph such as color
and style in the Dynamic Bar Attributes dialog box.