Jitter analysis and clock data recovery
R&S
®
RTP
1021User Manual 1337.9952.02 ─ 12
18.1.3 Jitter statistics and histogram
Since jitter is a random component of all signals, statistical measurement results are
required to characterize the jitter.
To get measurements statistics of a jitter measurement
Prerequisite: the jitter measurements are selected and configured, and the measure-
ment group is active.
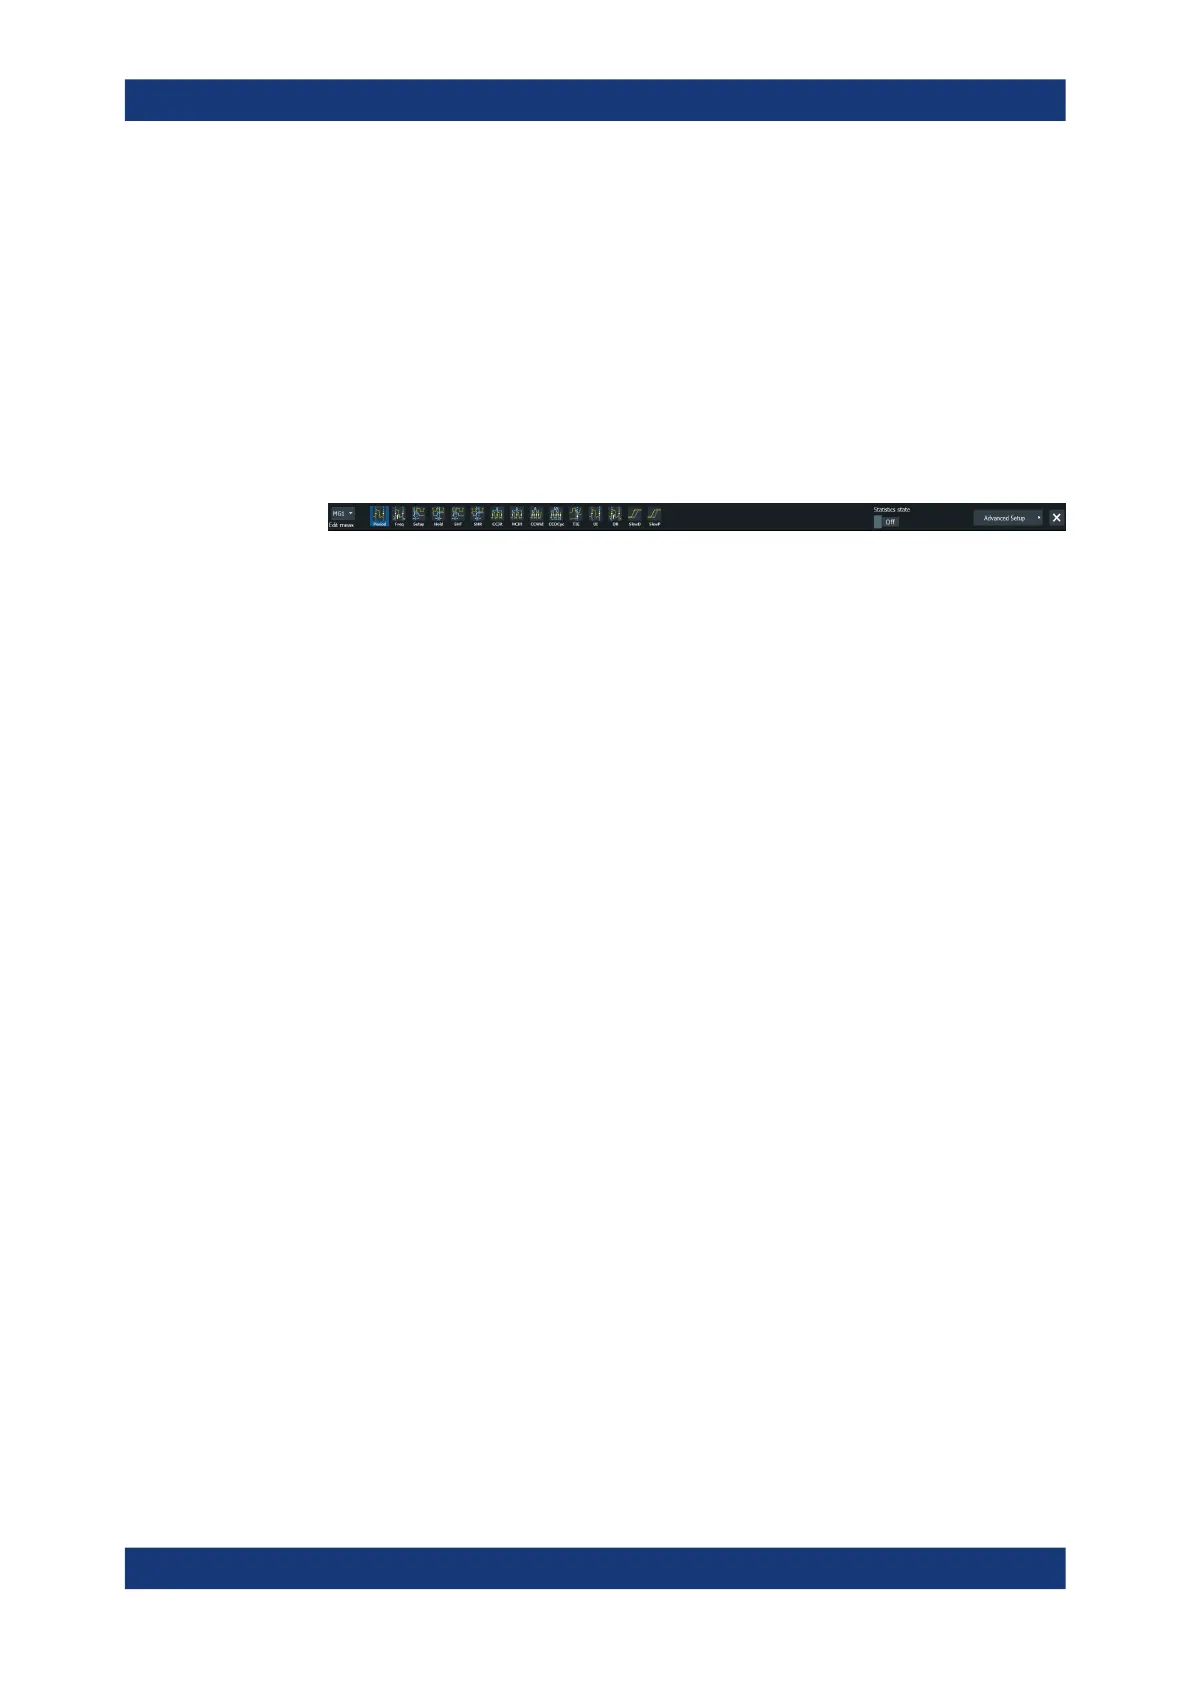
1. Double tap the "Meas Results" box.
The "Measurement" toolbar assist opens.
2. In the toolbar assist, enable "Statistics state".
3. Tap "Advanced Setup".
4. On the "Measure" > "Advanced" tab, enable "Measure all events in each acquisi-
tion".
The histogram plots the density of data. It shows the frequency of occurrence of the
measurement values. The maximum count of a measurement value is assigned to the
full height of the histogram diagram (= 1000). All other count values are displayed rela-
tive to the maximum.
To enable the histogram
1. On the "Plot" tab, enable the "Histogram".
2. If the histogram is not displayed as expected, disable "Continuous auto scale" and
adjust the "Meas scale".
18.1.4 Track of jitter measurement results
A track graph displays the results of the first jitter measurement from a single acquisi-
tion as a time-correlated waveform. To generate the track graph, multiple measurement
points are required. Thus, enabling the track automatically activates "Measure all
events in each acqu.".
You can measure amplitude and time on the track waveform: Configure a new mea-
surement group, e.g. "MG2", that uses the track waveform as measurement source.
You can also zoom into the track waveform, perform cursor measurements on it, and
export the track.
Jitter measurements (Option R&S
RTP-K12)

 Loading...


