K117sm8eE
8-236
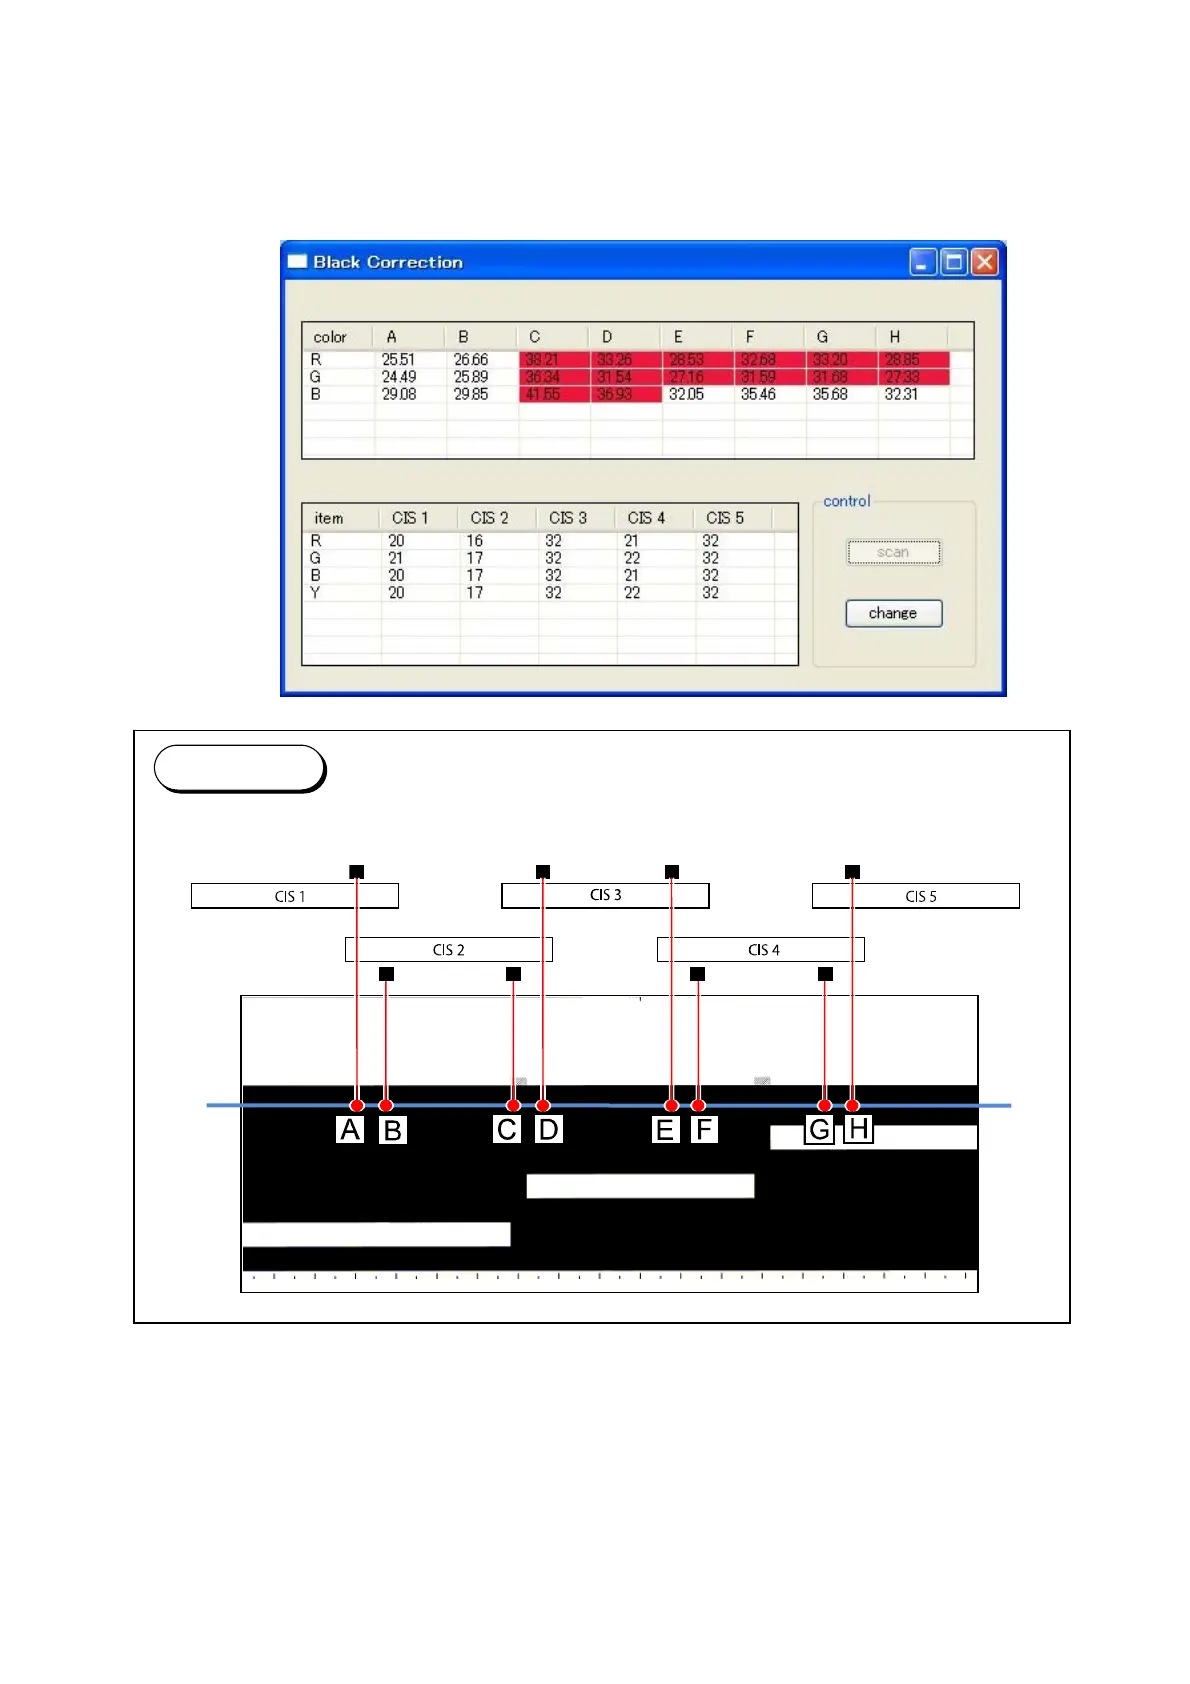
14. After the completion of the scan, “Black Correction” sub window appears.
The upper table shows the measured density at the border areas of each CIS.
At this time, if the values between the neighboring CIS reaches 4.00+, the concerning cell(s)
will turn red.
Follow the step 15 until the red cell disappears.
When all the cells turn white, go to step 16.
Reference
The columns A to H in the upper table correspond to the joint regions as follows.