2 Status
2.1 Dashboard
The Device Dashboard window shows the current status in graph or tables for quickly viewing the operation status of the
router. They are the System Information, System Information History, and Network Interface Status.
From the menu on the left, select the Status > Dashboard > Device Dashboard tab.
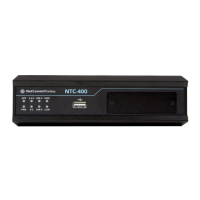
System Information Status
The System Information screen shows the device Up-time and the resource utilization for the CPU, Memory, and Connection
Sessions.
Figure 7 – System Information
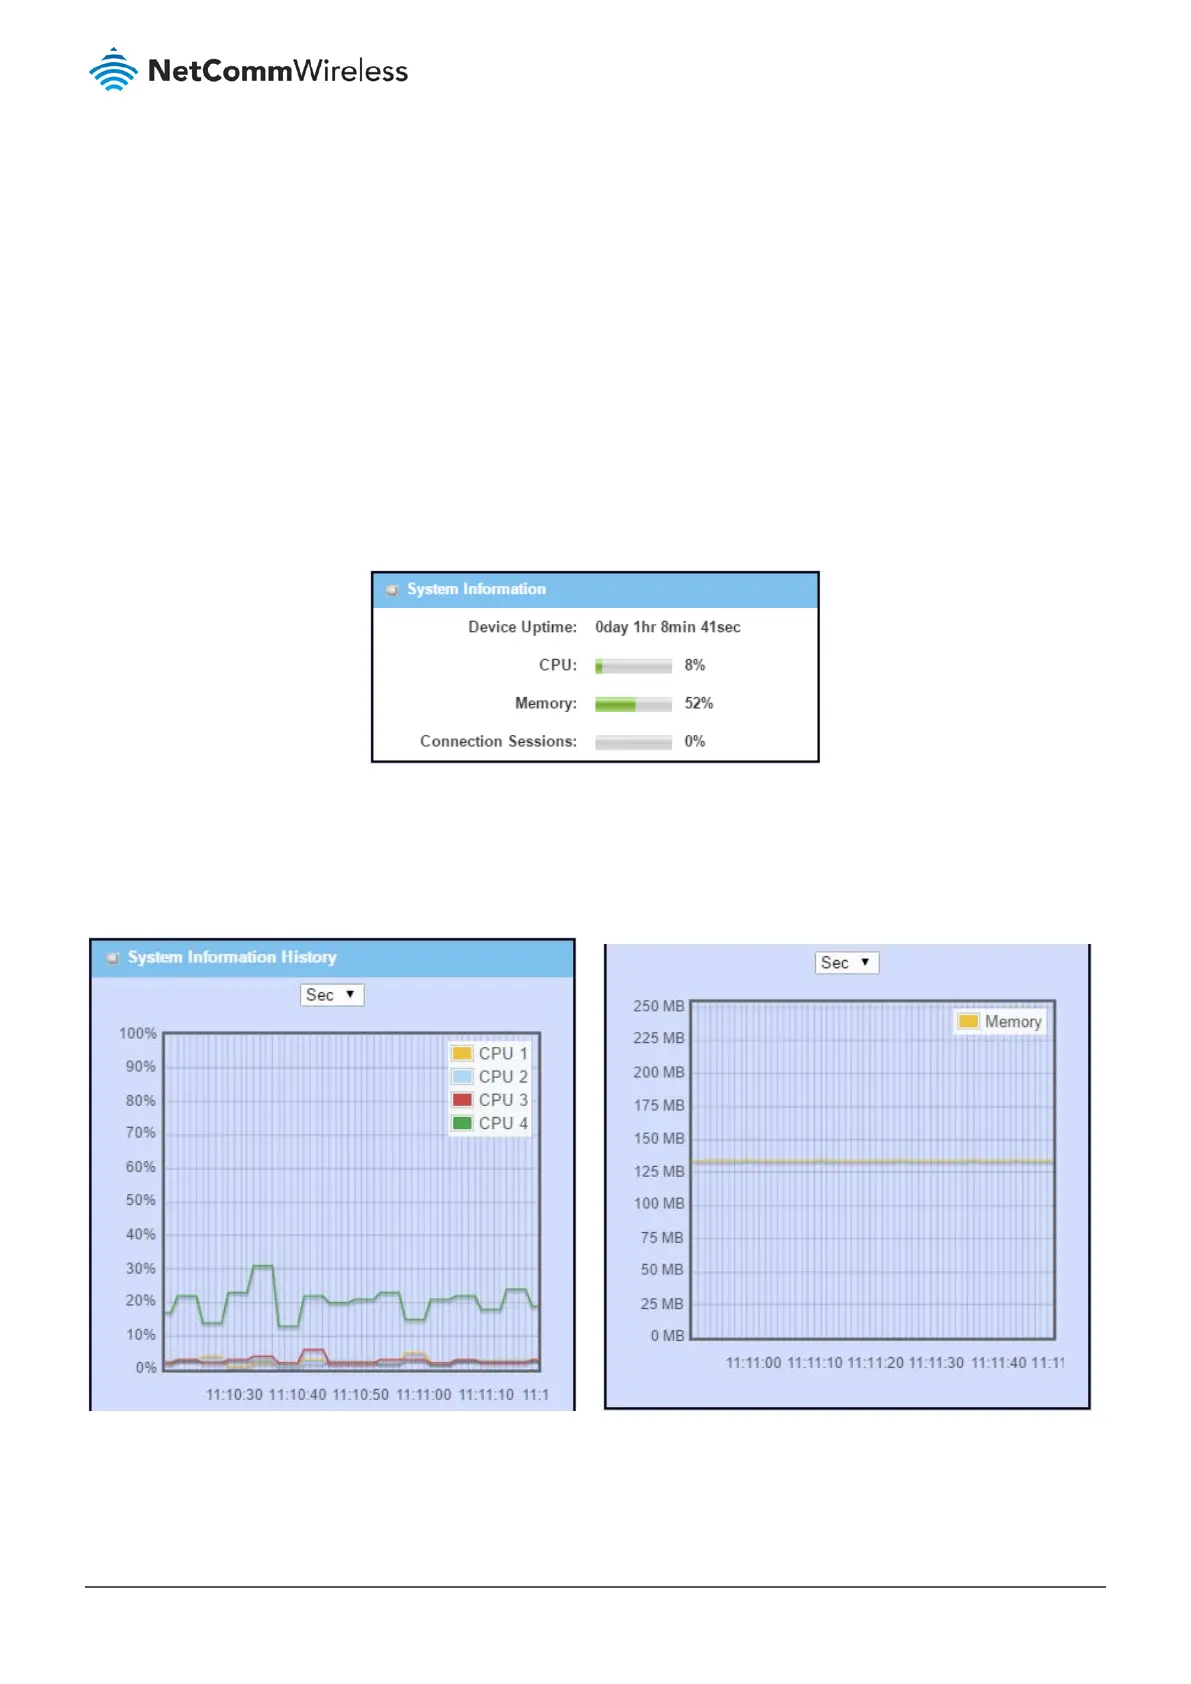
System Information History
The System Information History screen shows the statistic graphs for the CPU and memory.
Figure 8 – System Information History displays