Humphrey Field Analyzer II-
i
series User Manual 2660021145640 A
STATPAC Analysis & Printing
7-21
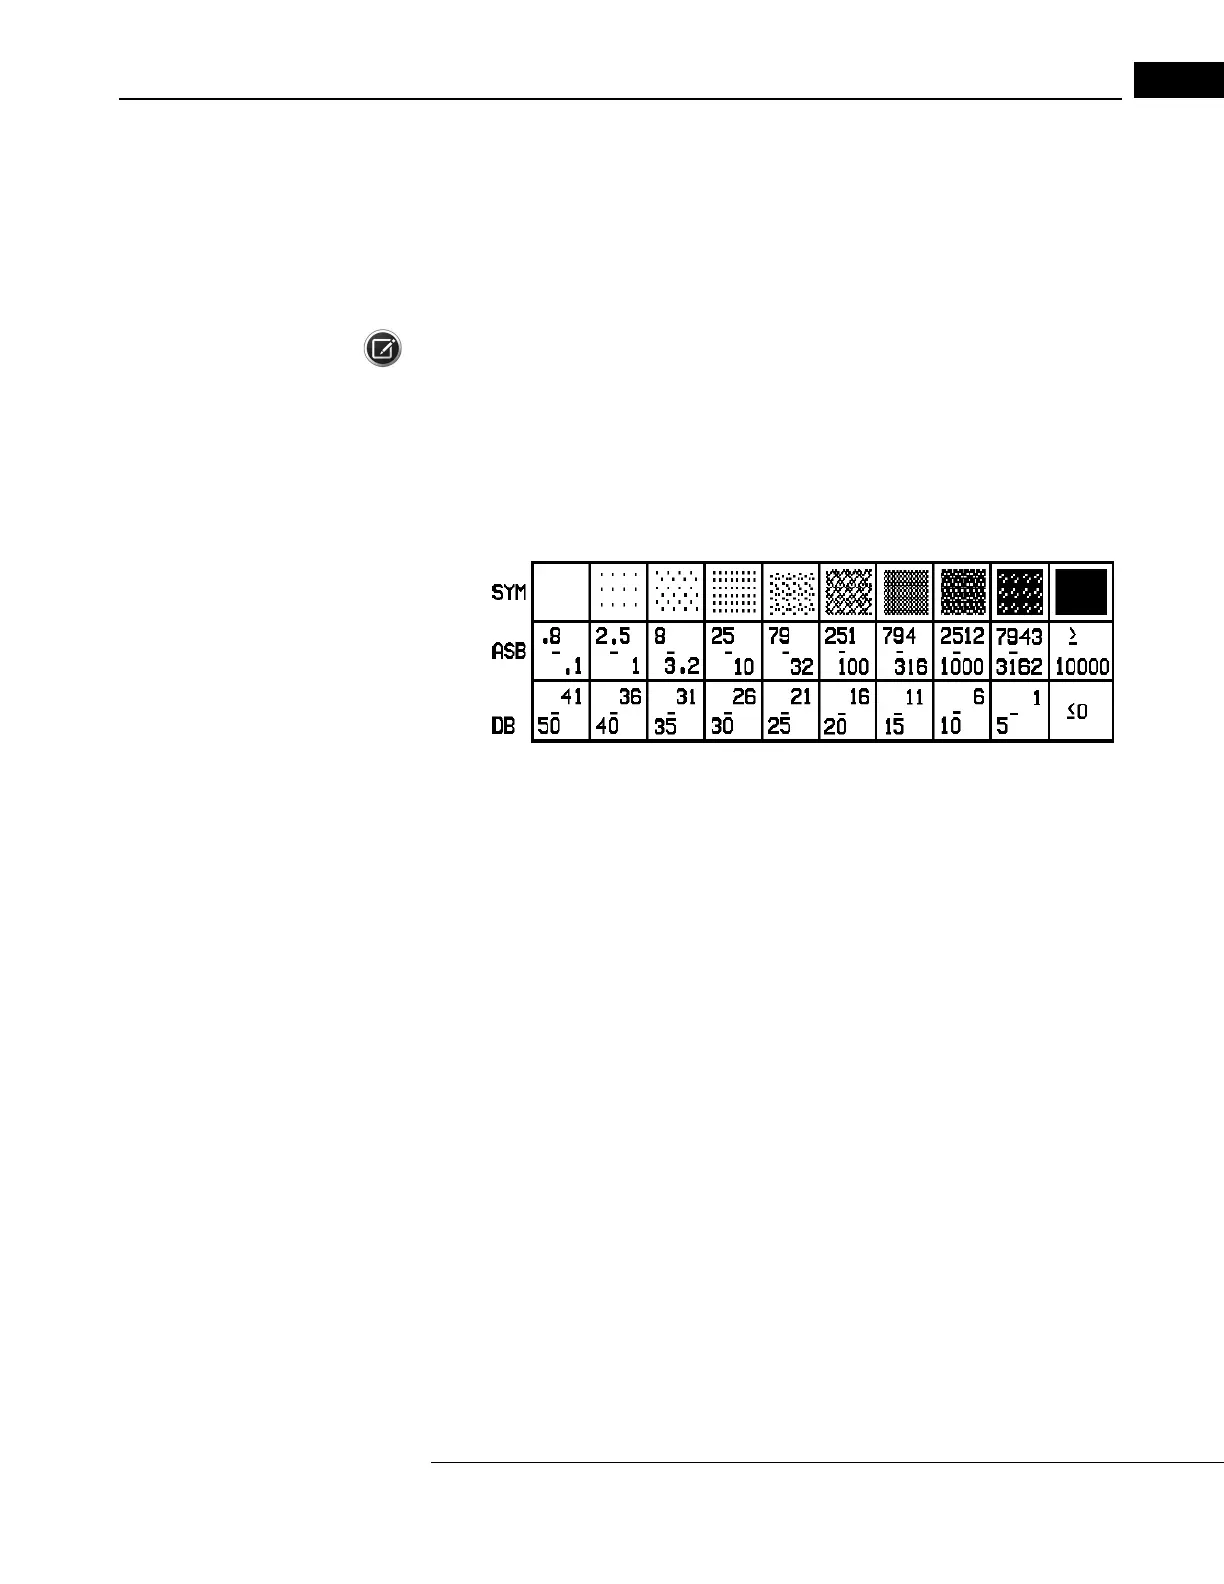
Grayscale Symbols
The grayscale representation of the patient’s visual field provides an immediate idea of the size and
depth of any field defects present. Each variation of the pattern corresponds to a 5 dB change in
sensitivity. The comparative scale that is shown below in Table 7.3 displays the ten (10) grayscale
patterns and relates them to decibels and apostilb
s. An explanation of the relationship between
these units of measurement can be found in Appendix (E), along with Goldmann conversion tables.
Note: SWAP printouts use the same relationship between grayscale
symbol and decibel values as
white-on-white testing. The grayscale will look significantly darker with SWAP testing in most cases.
This is because SWAP testing normally generates lower threshold sensitivity values than does
white-on-white testing. Note that the maximum (0 dB) stimulus in SWAP testing is 6 foot-lamberts,
not 10,000 apostilbs.
Table 7.3 The Grayscale Shades Found on HFA II-i Printouts and Their Numerical
E
q
uivalents in Apostilbs (ASB) and Decibels (dB).
 Loading...