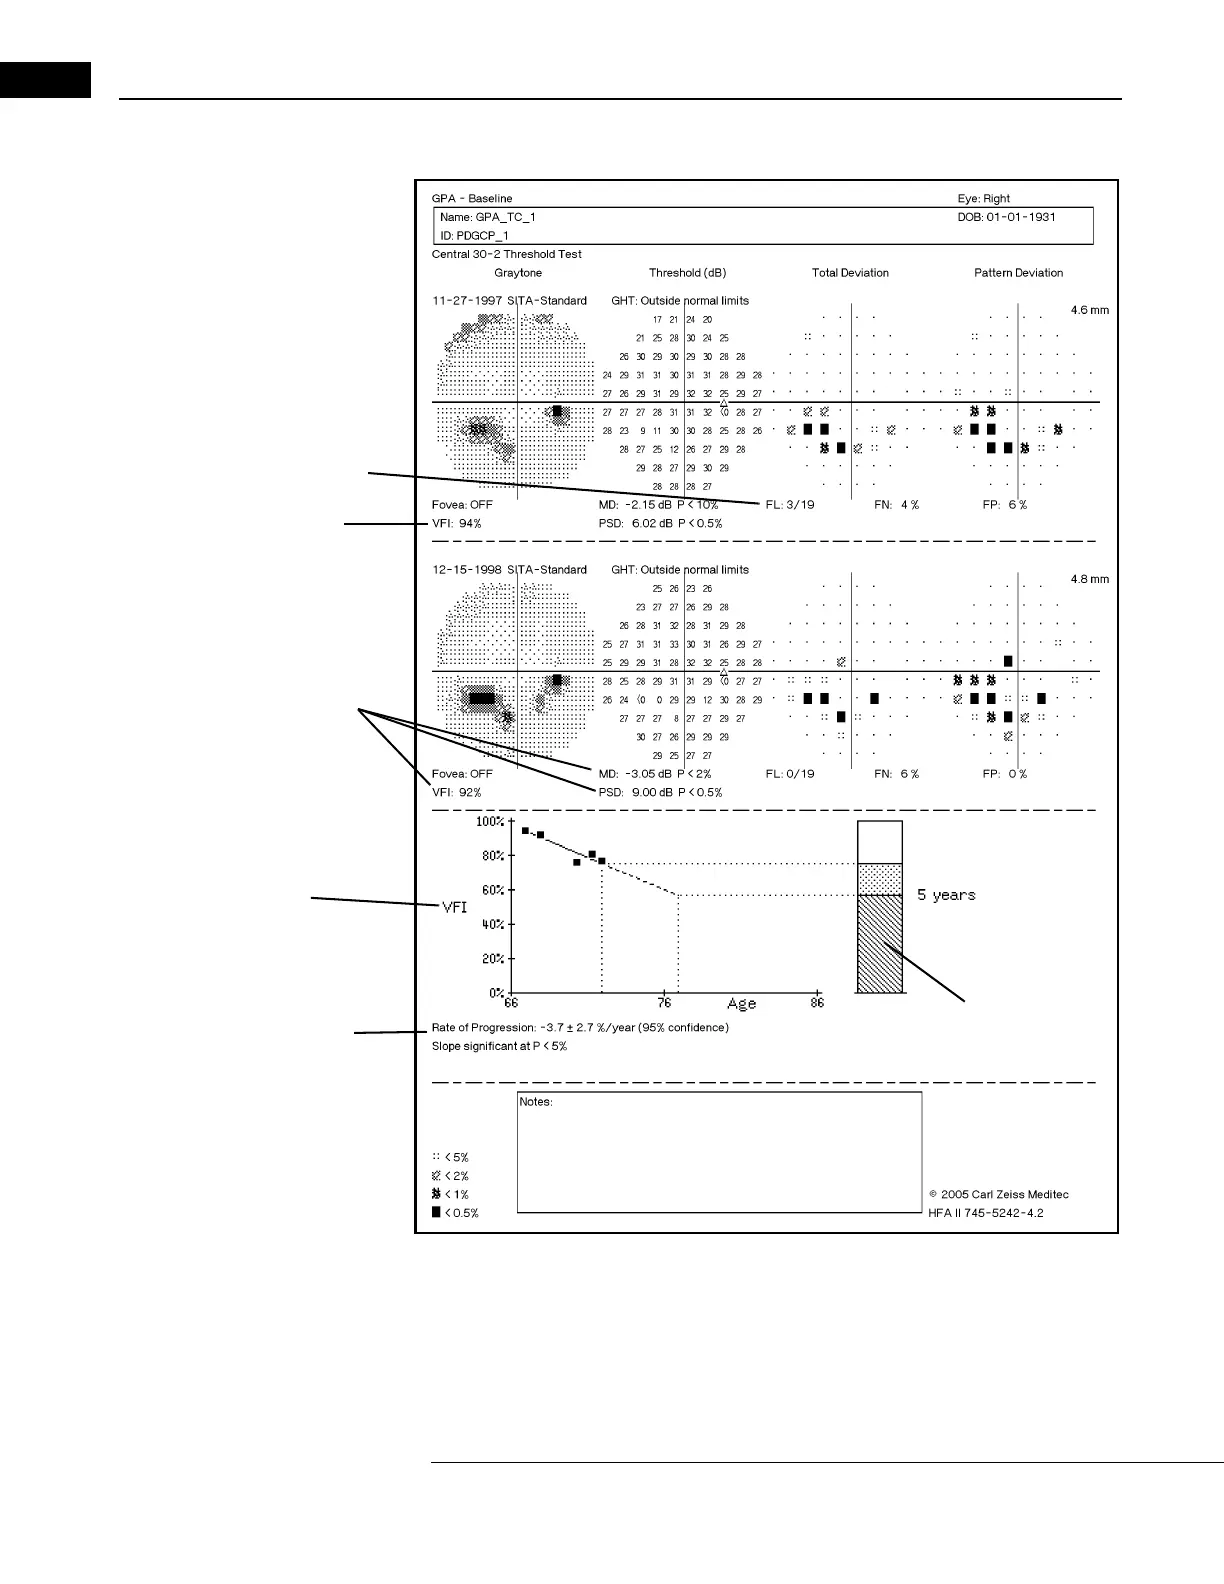
Linear regression
Reliability Indices
Global Indices
VFI Plot
analysis of VFI
VFI Bar
VFI Value
Guided Progression Analysis (GPA)
Humphrey Field Analyzer II-
i
series User Manual 2660021145640 A
8-8
Full GPA Report Example – Baseline Page
Figure 8.3 GPA Baseline Test Results from the Full GPA Report
The Full GPA Report (Figure 8.3) includes similar patient information to that appearing on other HFA
printouts. The Baseline data presentation mirrors the Overview
printout in its four columns:
Graytone, Threshold (dB), Total Deviation Probability Plot, and Pattern Deviation Probability Plot. A
trend plot with regression analysis (when appropriate) of the VFI is provided for each test included
in the analysis.
 Loading...