Humphrey Field Analyzer II-
i
series User Manual 2660021145640 A
Reference to Older Test Strategies
L-7
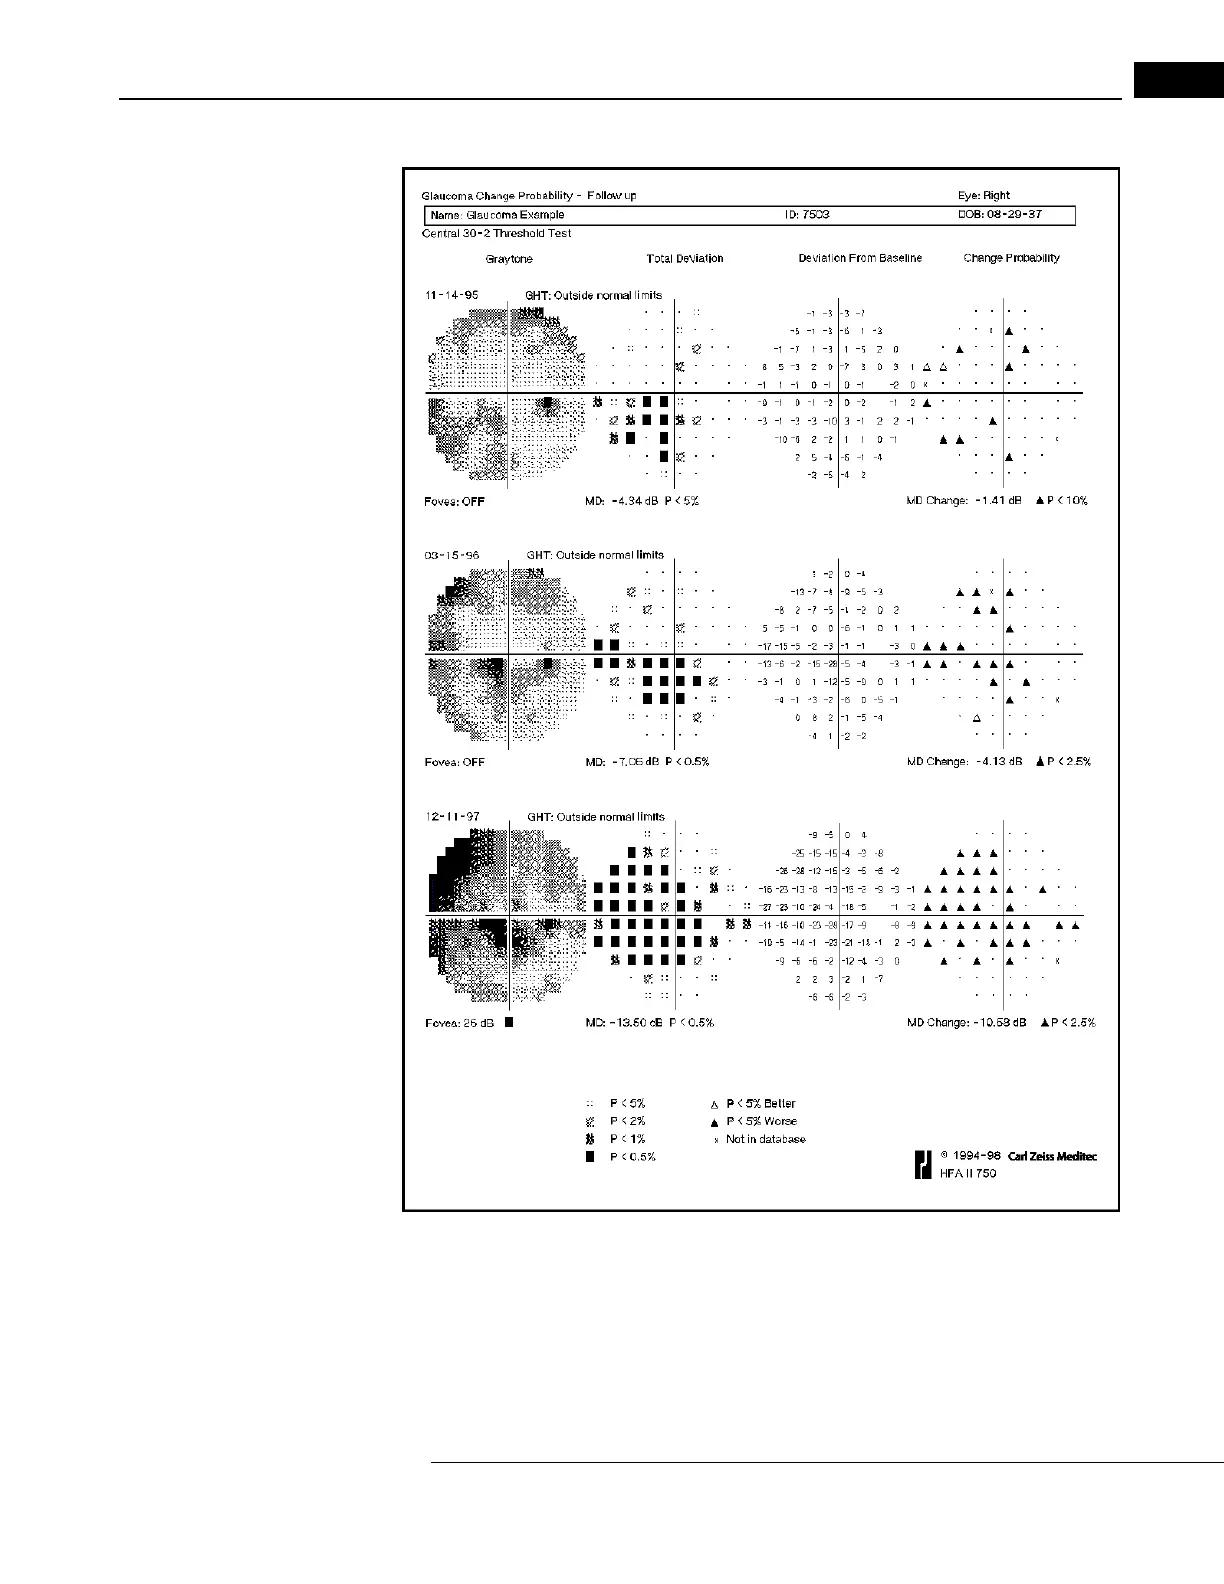
Figure L.3 The Glaucoma Change Probability – Follow Up
The glaucoma change probability printout (Figure L.2 and Figure L.3) includes the patient
information that appears on other STATPAC printouts. Tw
o data presentations (graytone and total
deviation plot) for the Baseline tests are printed on the upper left section of the printout. A plot of
the Mean Deviation (MD) for each test plus the linear regression analysis of mean deviation, which
is discussed below, occupy the upper right section of the printout. The first column on the left of the
printout contains the graytone presentation of test results. The total deviation plot appears in the
 Loading...