Guided Progression Analysis (GPA)
Humphrey Field Analyzer II-
i
series User Manual 2660021145640 A
8-26
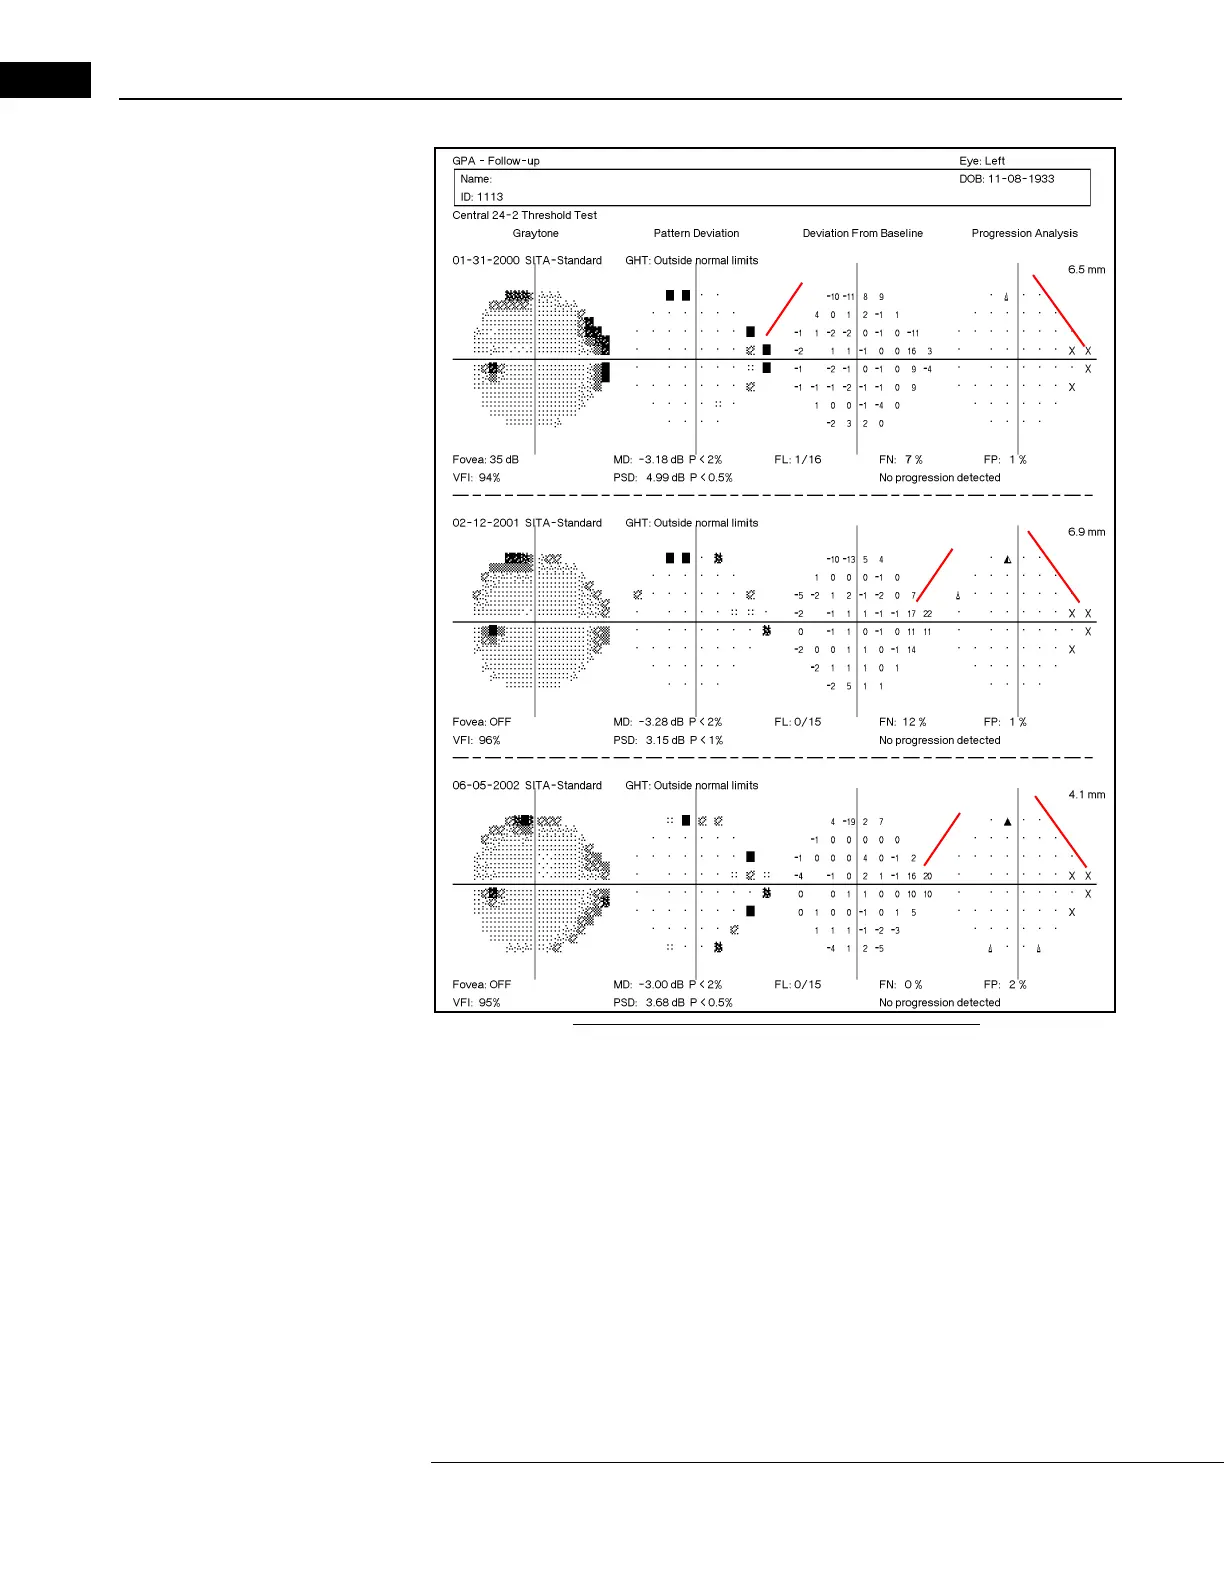
Figure 8.12b Improving Out of Range Points – Follow Up 1
On subsequent Follow-up visits, these points D are appropriately marked as “Out of Range”.
Reviewing the Deviation From Baseline chart for the second and third Follow-up visual fields
indicates large positive values for these points E. This suggests improvement in the Pattern
Deviation values at these points. This amount of improvement is unlikely and probably indicates
either learning by the patient or a trial lens artifact that was present during the Baseline tests but
which had been rectified in later tests.
An additional hint is provided by the VFI Plot seen below
the Baseline visual fields in Figure 8.12a.
The plot shows the first two tests in the sequence (
the two tests chosen by the HFA as the default
Baseline tests) with a reduced VFI compared to the later tests F. This may help you see how the first
two tests may have been affected and their subsequent effect on the Follow-up tests. In this case,
the result created points marked as “Out of Range”. Changing the original Baseline to a more
appropriate pair of Baseline tests resolves this situation. See next page.
 Loading...