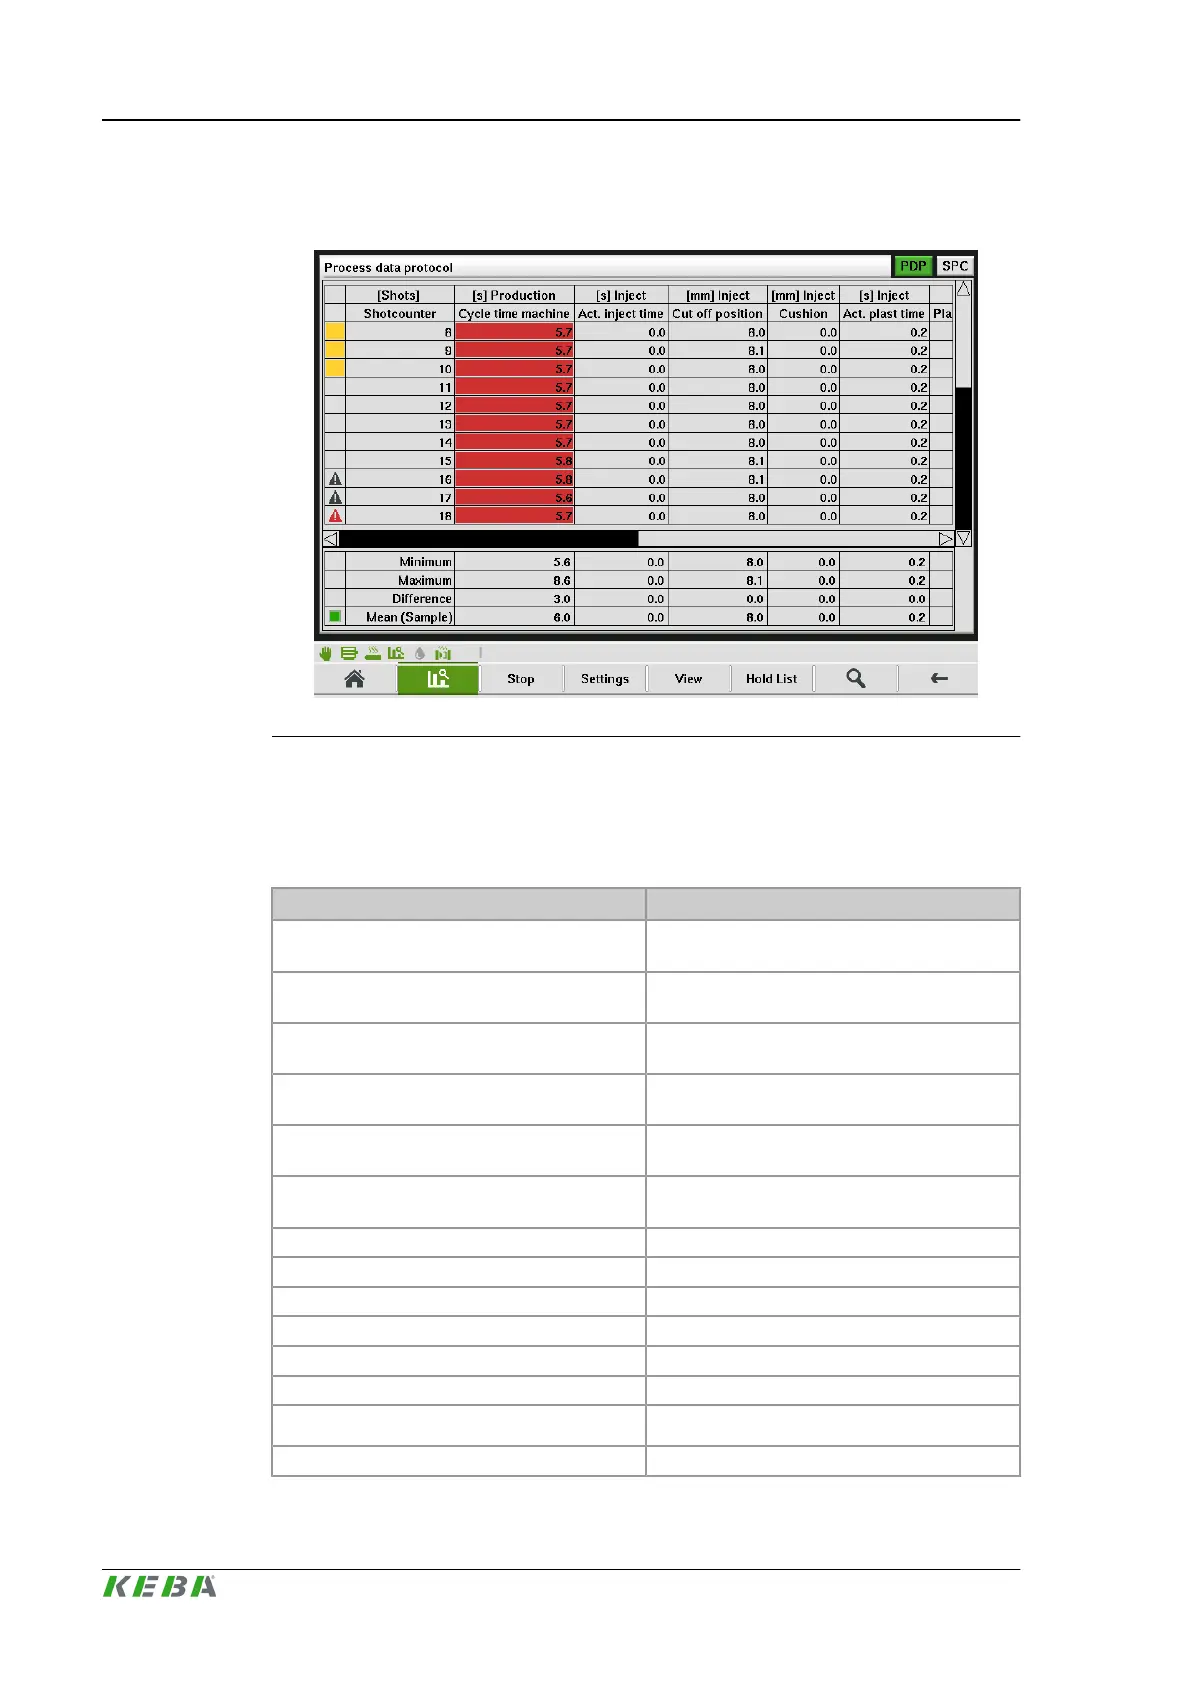
If a value in a cell is out of the corresponding bounds it is additionally marked
in a red color.
Fig.4-65: Mask "Process data protocol"
4.61.3 Description of the elements
Table
Field Description
Minimum
The lowest value that was recorded for each
respective variable is displayed.
Maximum
The highest value that was recorded for each
respective variable is displayed.
Difference
Display of the difference between maximum
and minimum value.
Mean
The mean value that was recorded for each re-
spective variable is displayed.
Actual value
Shows the current value of the respective var-
iables.
Mean (Sample)
Shows the current sampled mean value of the
respective variables.
Stddev Standard deviation for all recorded lines
Stddev (Sample) Standard deviation for the current sample.
cmk (Sample) Machine capability
cm (Sample) Machine mastery
cpk Process capability
cp Process mastery
Error count Error counter for each variable.
Warning count Warning counter for each variable.
Description of the operating masks KePlast.HMI.KVB
© KEBA 2016
User's manual V3.05144
 Loading...