4.4 Mold - Tab Graphic
4.4.1 Purpose
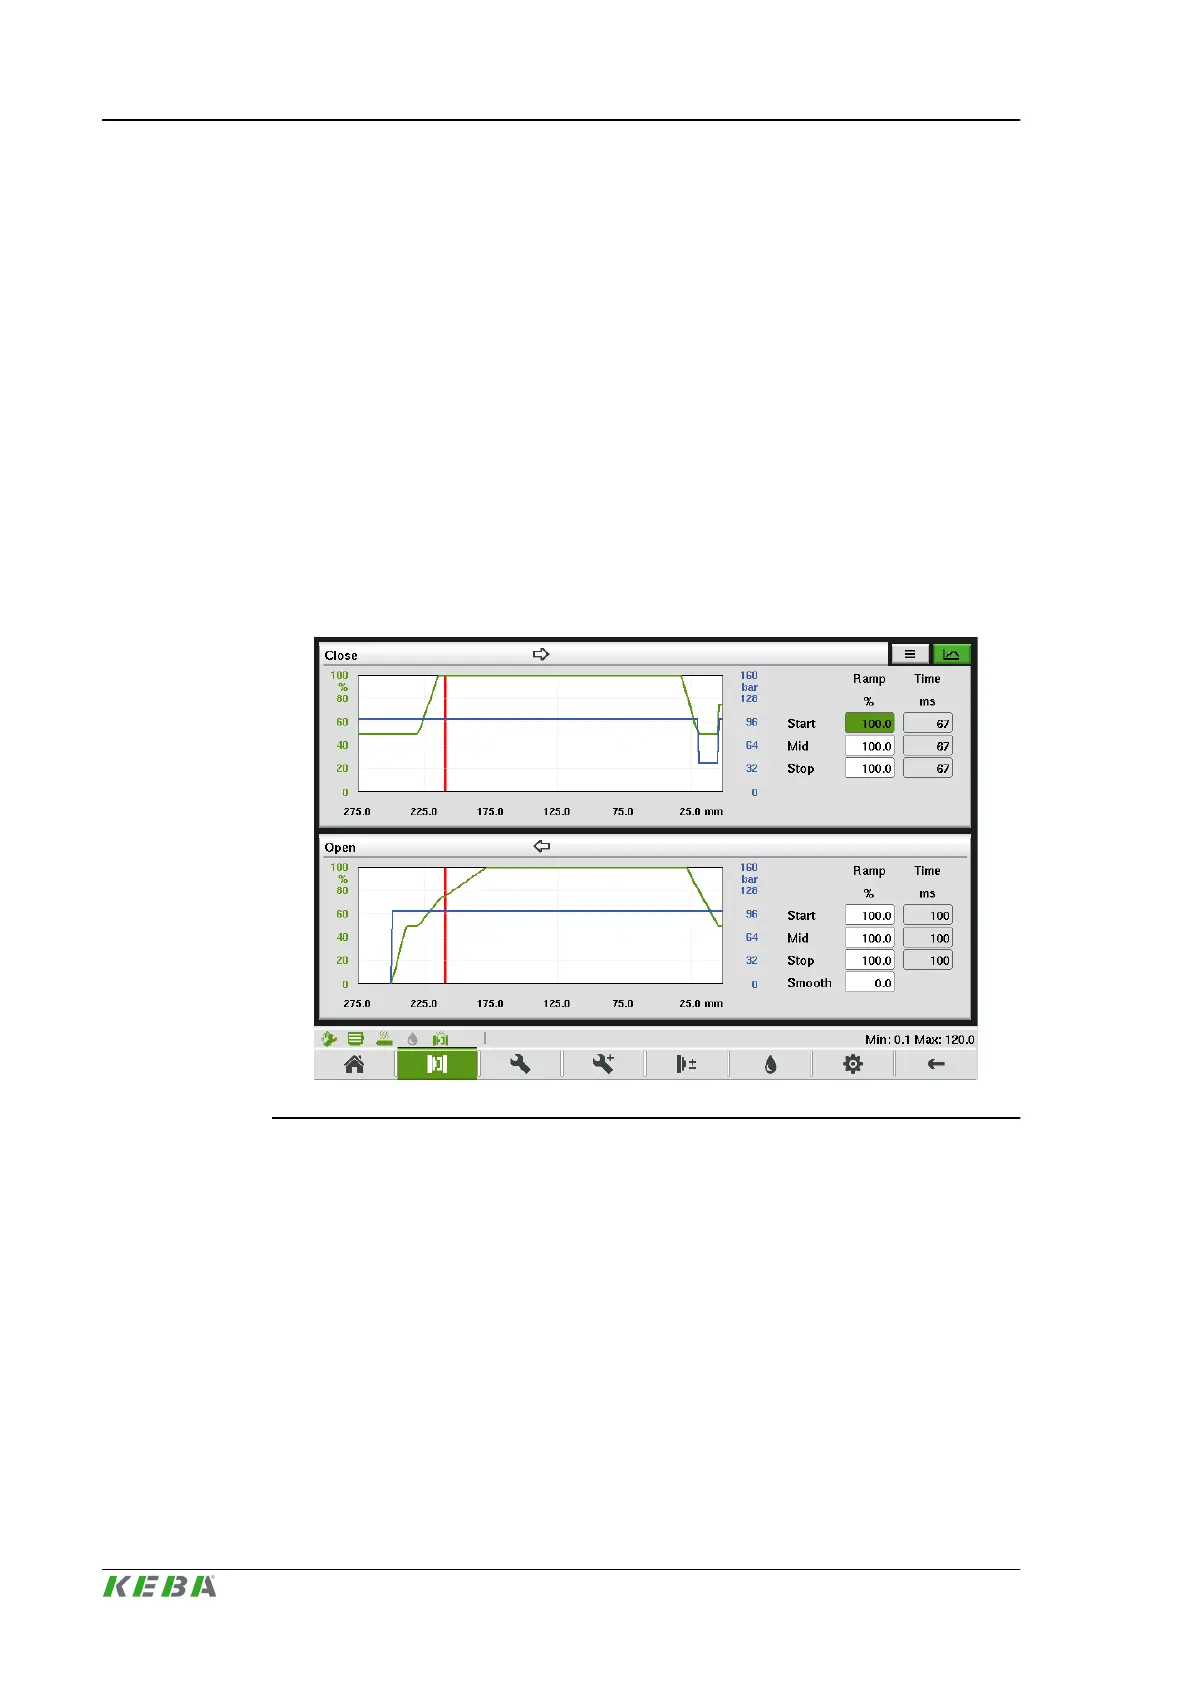
This mask shows the pressure and velocity profile of the mold movement
graphically.
4.4.2 Description of the mask
The upper section of the mask displays the mold close profile and the lower
section of the mask the mold open profile. Arrows on top of the graphics display
the direction of the profile. A red line in the graphics displays the actual position
of the movement.
Further ramp settings for the respective movement can be set. Depending on
the configured ramp setting the corresponding ramp duration for the movement
is calculated.
Fig.4-6: Mask "Mold profile graphic"
Description of the operating masks KePlast.HMI.KVB
© KEBA 2016
User's manual V3.0546
 Loading...