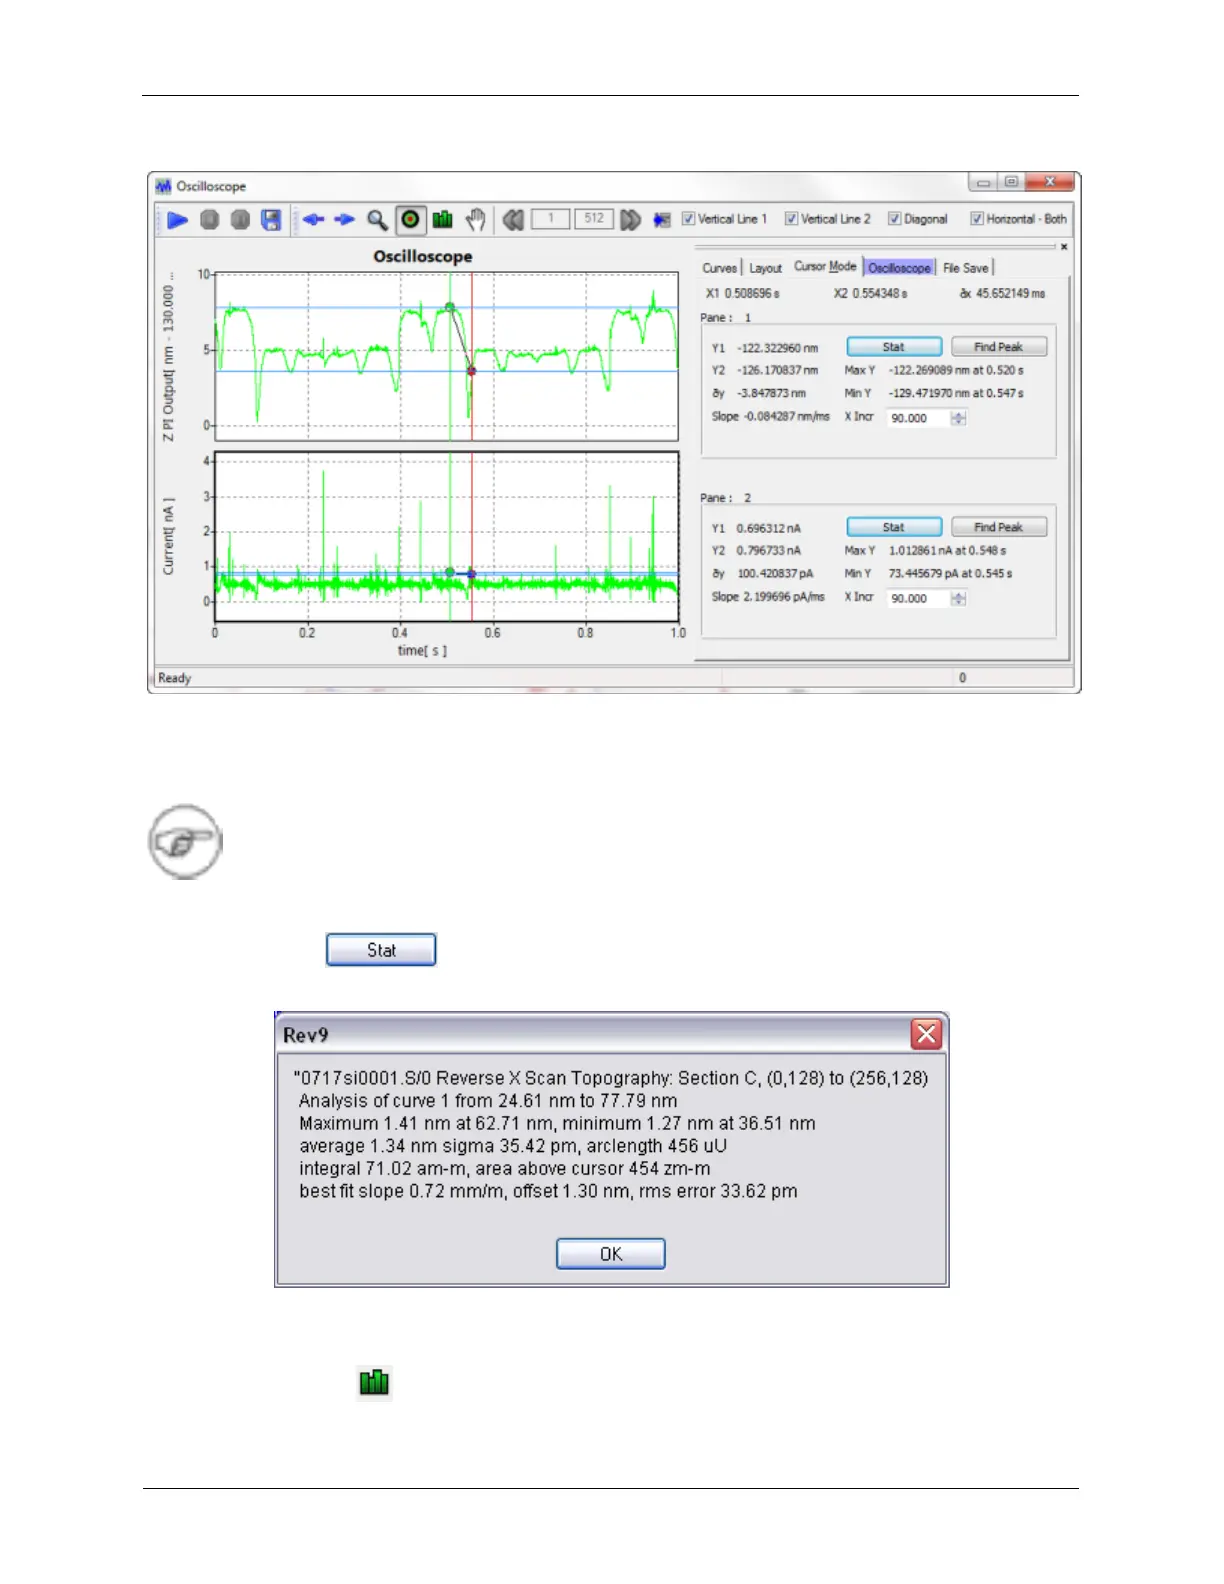
Figure K.16. XY Graph Toolbar - Cursor Mode
Cursor Mode can be used to make measurements on a curve in the XY Graph Window. The two
endpoints are chosen by clicking and dragging the mouse inside the XY Graph Window. Some quick
information is available on the Cursor Mode tab.
Note
Additional Cursor options are now available: Two vertical cursors, one diagonal cursor,
and horizontal cursors. Cursors now move on all graph panes to help lineup features.
K.2.1.3.1 Statistics
Figure K.17. Cursor Mode Statistics Dialog Box
Pressing the Stat button on the Cursor Mode tab will open the Statistics Dialog. The statistics are relative
to the data between the two cursor endpoints.
K.2.1.4. Autoscale