• 2nd Derivative: numerically calculates the second derivative of the data over a certain number of
points.
• Integral: numerically calculates the integral of the data over a certain number of points.
• Density of State: numerically calculates dI(V)/dV / I(V)/V. A zero threshold can be set to prevent division
by zero.
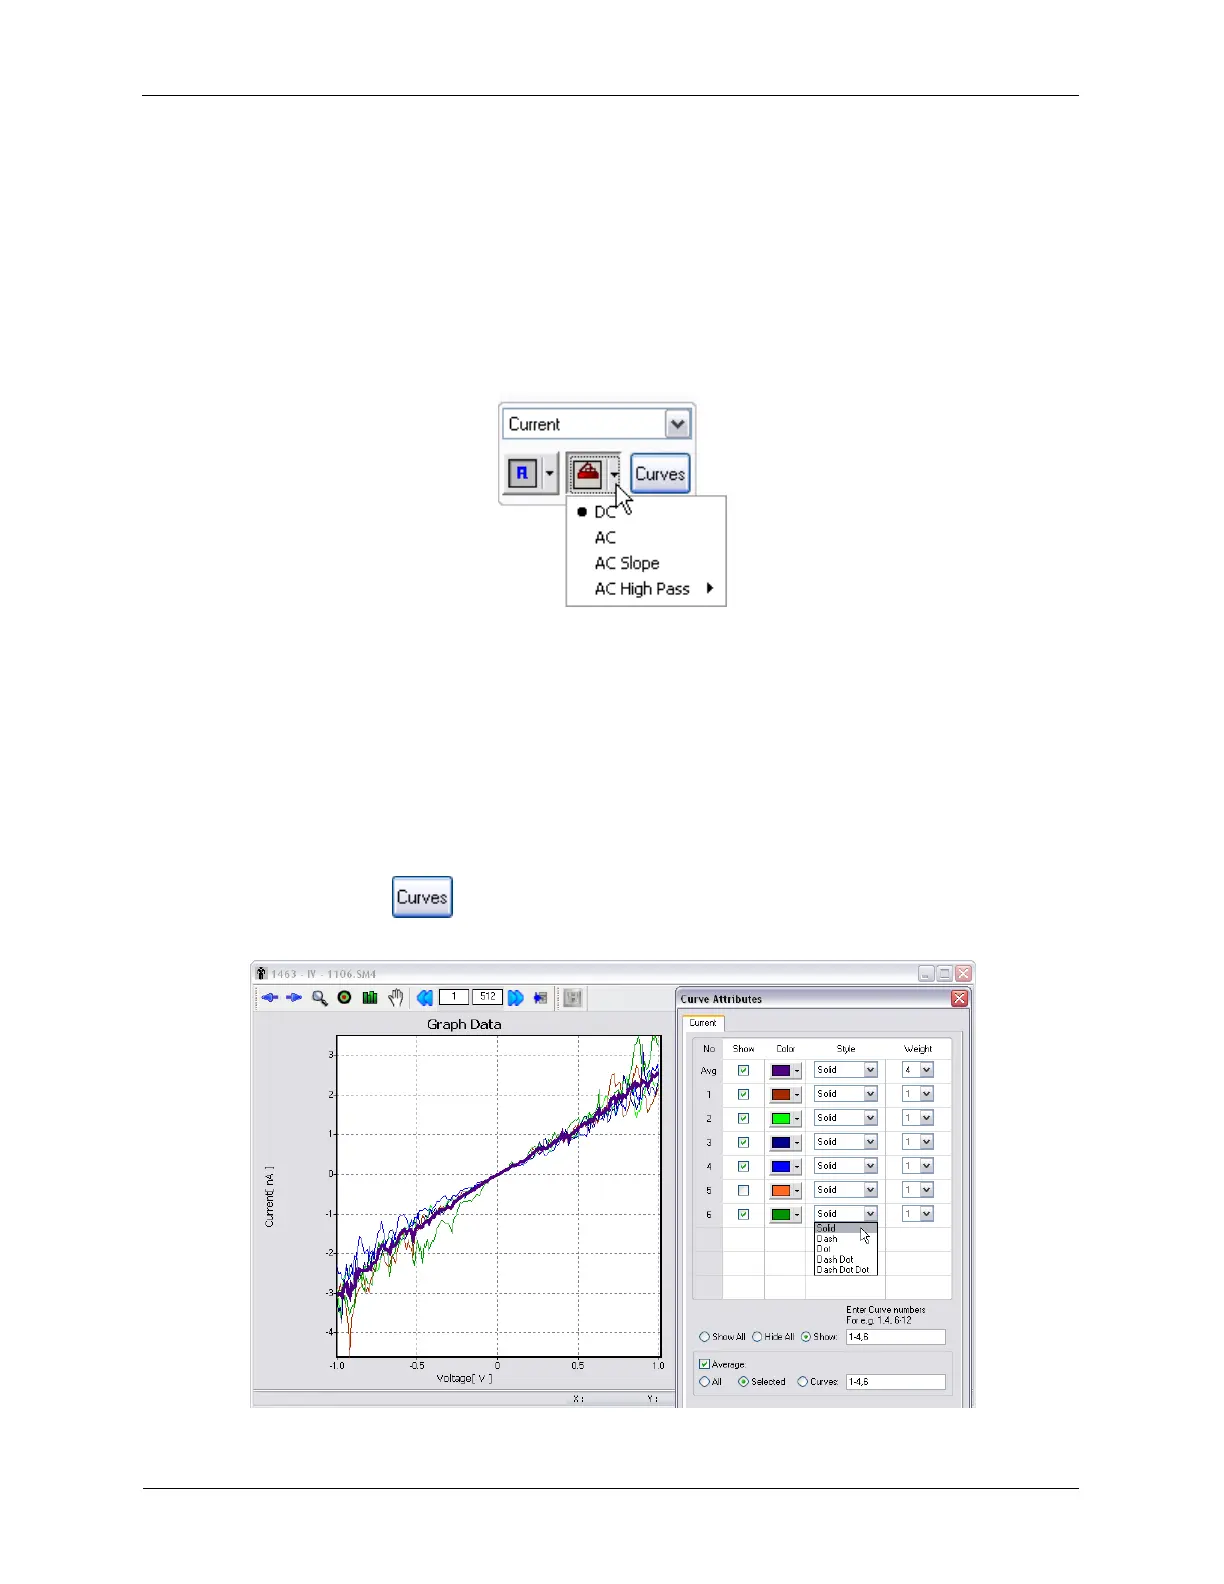
K.2.2.1.3 Display Modes
Figure K.25. XY Graph Settings - Display Modes
There are 4 Display Modes that can be used. The Display Modes can be previewed by moving the mouse
cursor over the different modes. The Display Modes are DC, AC, AC Slope, and AC High Pass.
• DC: displays unmodified data.
• AC: subtracts the average value of the data to make the average value equal to zero.
• AC Slope: subtracts the average slope from the data.
• AC High Pass: subtracts the DC offset and any small curvature in the data due to nonlinear effects.
K.2.2.1.4 Curve Attributes
Figure K.26. XY Graph Settings - Curve Attributes