The Oscilloscope has the following settings:
• Data Rate: controls how many samples per second will be acquired.
• Time / Div: sets the duration of the
• Samples: this will equal the Data Rate x Time/Div x 10.
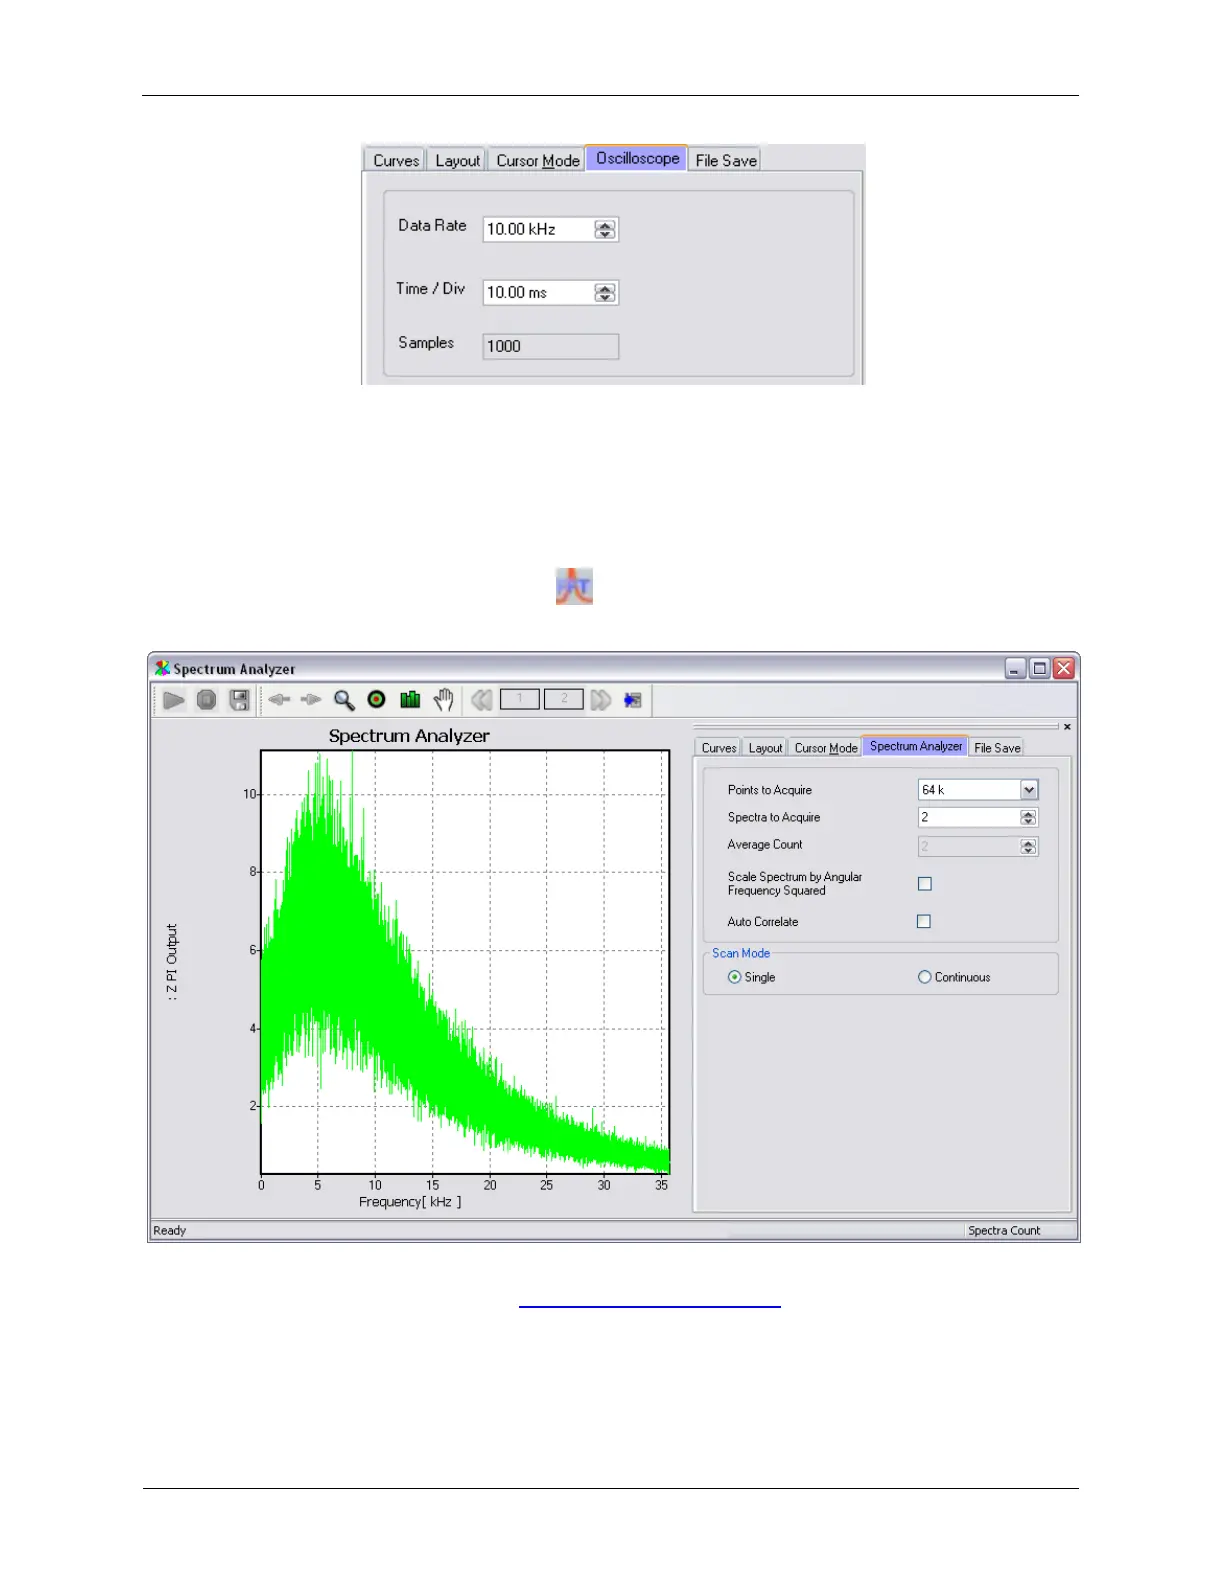
K.4. Spectrum Analyzer
Figure K.32. XY Graph Spectrum Analyzer
The Spectrum Analyzer is an XY Graph Window so most of its controls will have the same function as
other XY Graph Windows. Please see the XY Graph Window Reference section for more information.
Signals that are connected to Measure Items in Hardware Space will be available for display on the
Spectrum Analyzer. Up to four signals can be displayed on the Spectrum Analyzer simultaneously. These
signals can be selected on the Curves tab.