Acquire Spectroscopy Data
3. The Harmonic Factor of the Lock-in Amplifier is set to 1.0 and hidden by default. Set the Phase Offset
of the Lock-in to 0 degrees.
4. Set the Oscillation Amplitude edit box in the CH1 Drive to about 1% to 10% of the total Bias Voltage
sweep range, that is of the magnitude of the difference between the Initial Value and Final Value set in
the Spectroscopy Settings edit box. (This can be adjusted later to optimize signal to noise and
resolution of the dI/dV curve.)
5. Initialize the R9 if not already initialized by clicking on the Initialize button in the Execute section of the
R9s Ribbon bar.
6. Set the Filter Cut off Frequency to about 125 Hz (assuming your Bias Voltage sweep takes about 40
ms (25 sweeps per second) or more, if it is faster, then you should increase this cut off frequency to be
at least twice as fast as the sweep frequency.
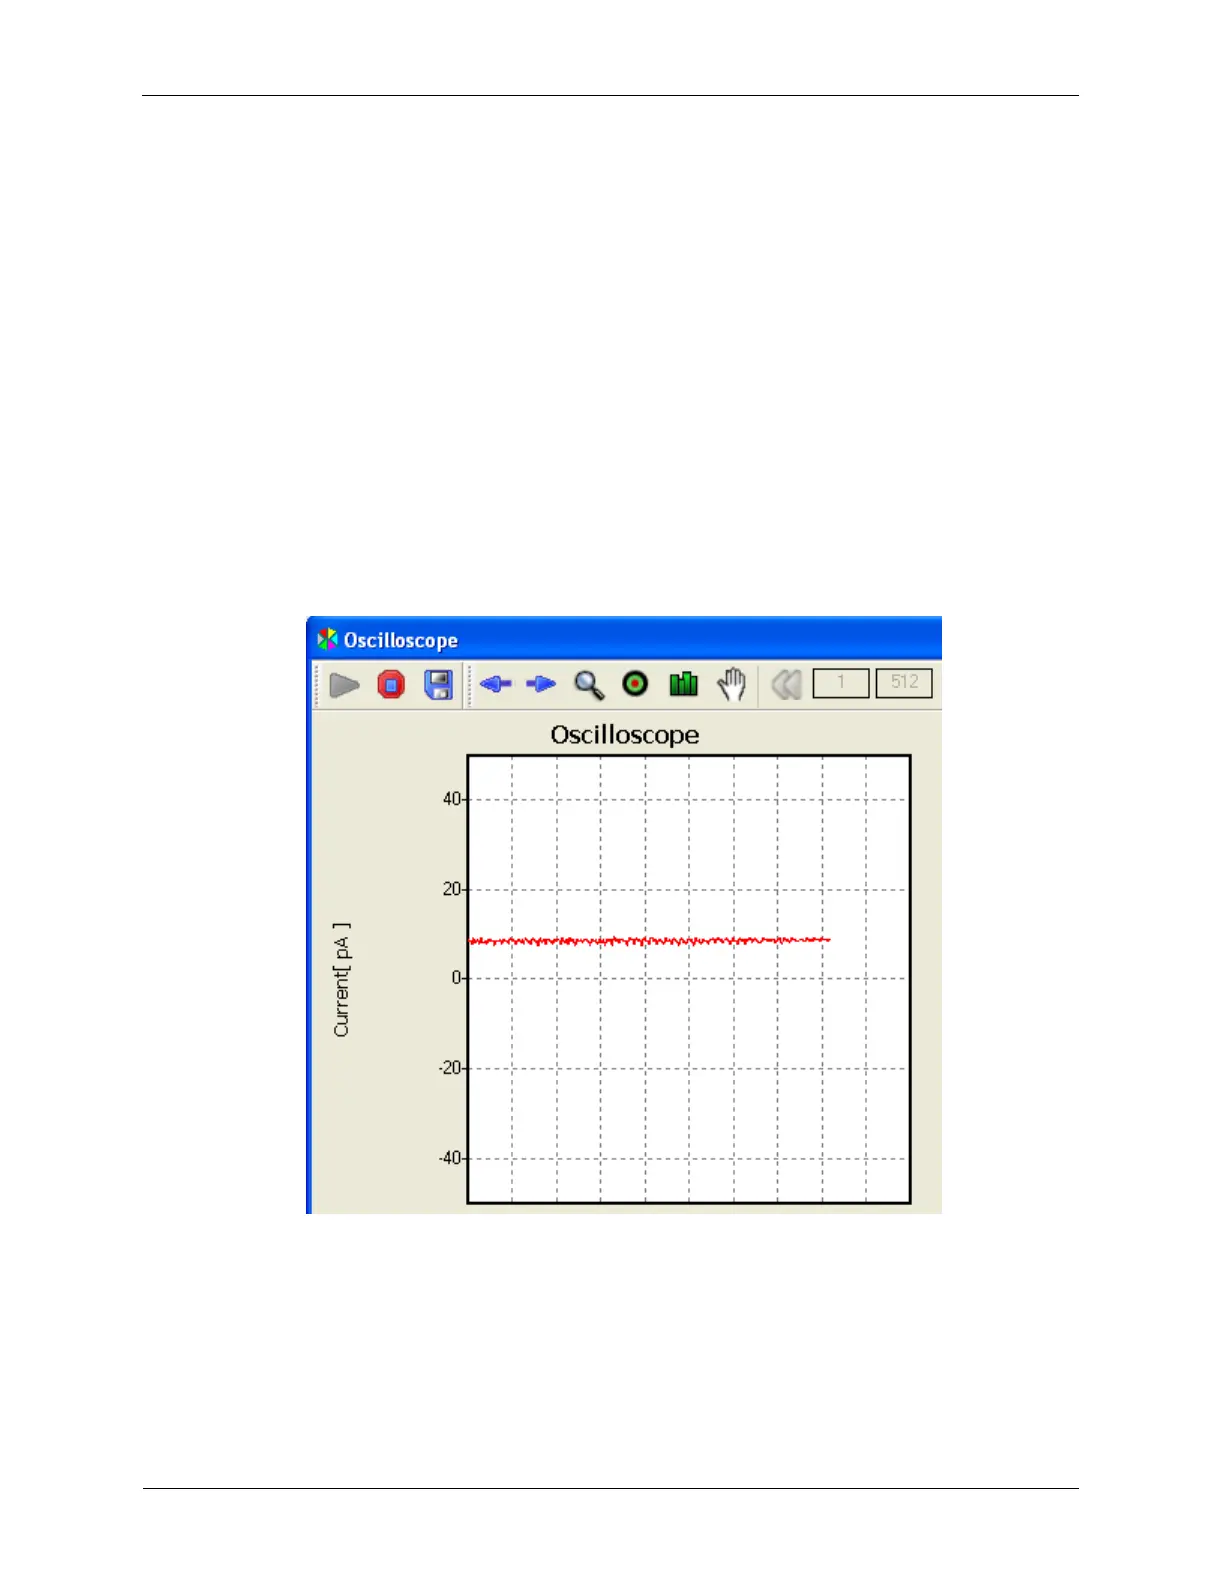
7. The Phase Offset now needs to be adjusted so the Oscilloscope trace is a maximum positive value.
The trace for the above conditions is shown below.
Figure 6.11. The 'dI' Oscilloscope Trace for 2mV Oscillation Amplitude shown
above and a series resistance of 200 Meg Ohms
8. Now begin the dI/dV Spectroscopy procedure and refine the parameters until you have a curve that
matches your expectations.
6.3.1 Background for dI/dV measurement
A dI/dV measurement is a type of ramp spectroscopy measurement. The Bias Voltage (V) is modulated
(dV) while measuring the tunneling current (I) and the change of the tunneling current (dI). Then dI is
plotted against V. This is shown in the figure below for a simulated tunnel junction operating in the