Acquire Spectroscopy Data
connected and the Gate acting as the diode cathode. A series resistor of 100 Megohms was used to set
the current level appropriate for using the IVP-200 as the input preamplifier.
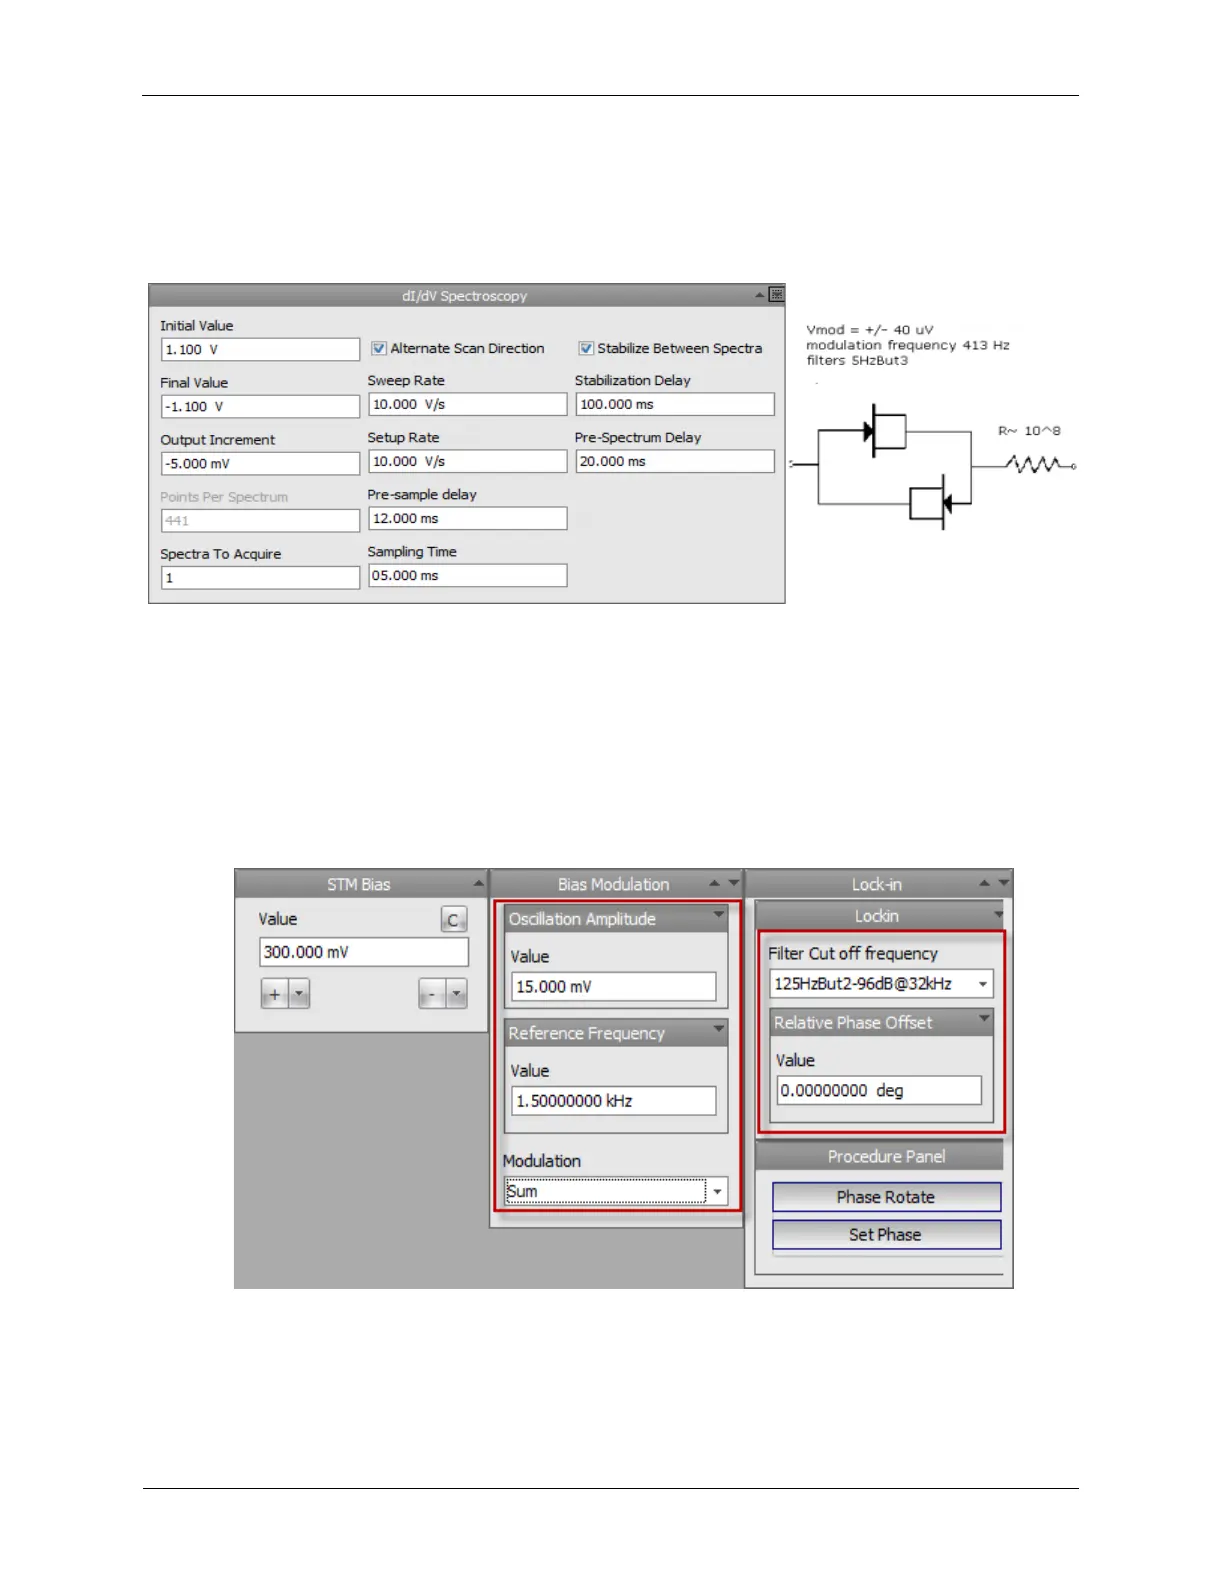
Figure 6.9. Spectroscopy Settings and Circuit Diagram for the Trial dI/dV
Spectroscopy
In your case, you will have a real tunneling probe in operation. Modify the above settings to reflect the
correct values for your system. Then complete an I/V trace at a single location. It should resemble this
above result. Repeat the Bias Spectroscopy experiment until you are confident in these settings. Use
these settings as the basis for the dI/dV experiment.
This experiment is implemented in the following way.
1. Modify the Lock-In component of the Dashboard as shown below.
Figure 6.10. Modification to Pre-configured UHV300 Dashboard
The Lock-in configured for STM should resemble the diagram. The marked settings control the
modulation and demodulation behavior.
2. Choose the modulation frequency on the Bias Modulation panel.