The Curve Attributes dialog can be used to customize the XY Graph Window's displayed curves.
Individual curves can be shown or hidden. The average curve can also be displayed. Specific curves can
be included or ignored when calculating the average curve.
• Show: individual curves can be displayed or hidden by checking or unchecking the Show checkbox.
• Color: each curve has its color set automatically but the user can also set the colors manually.
• Style: There are 5 different display styles that can be used. These are Solid, Dash, Dot, Dash Dot, and
Dash Dot Dot.
• Weight: A curve's line thickness can be set to make it easier to see. Above, the Average curve has its
Weight set to 4.
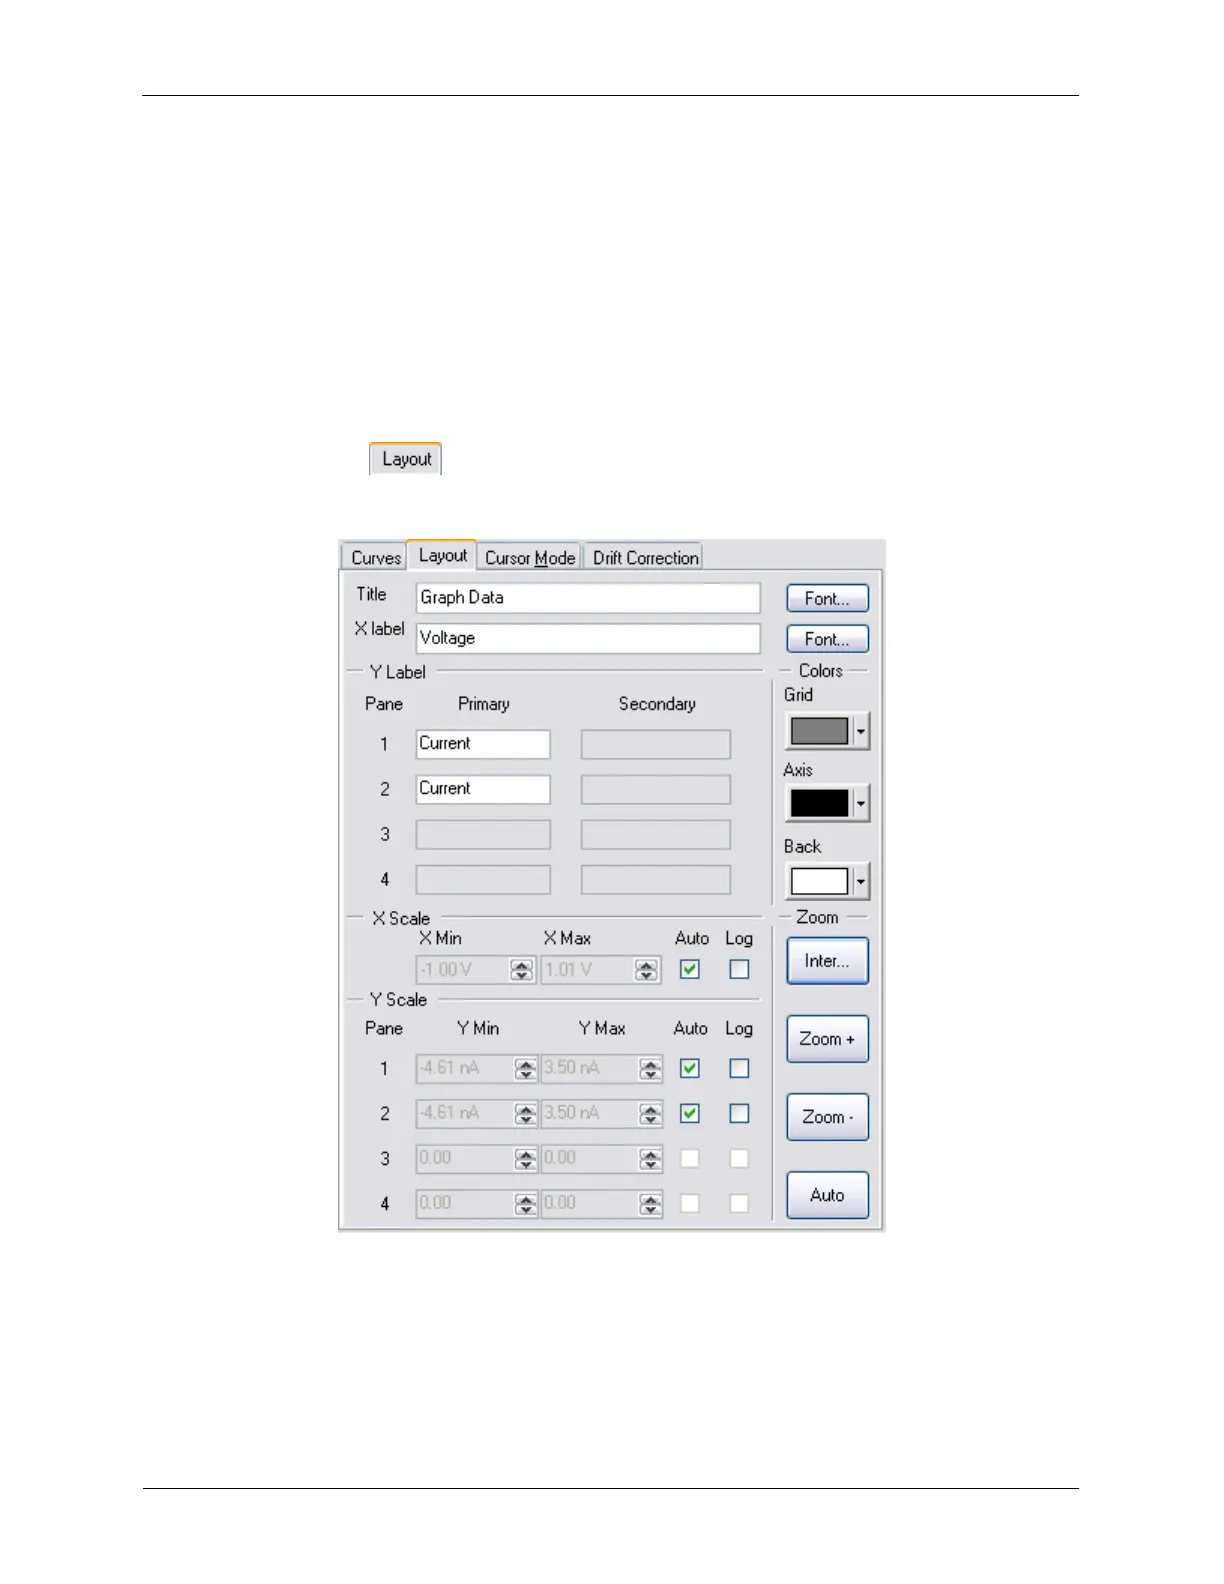
K.2.2.2. Layout Tab
Figure K.27. XY Graph Settings - Layout
The XY Graph Window has more display controls on the Layout Tab.
• Title: sets the title of the XY Graph Window.
• X Label: sets the label of the X Axis on the XY Graph Window.
• Y Label: each display pane can have its Y Axis label changed.