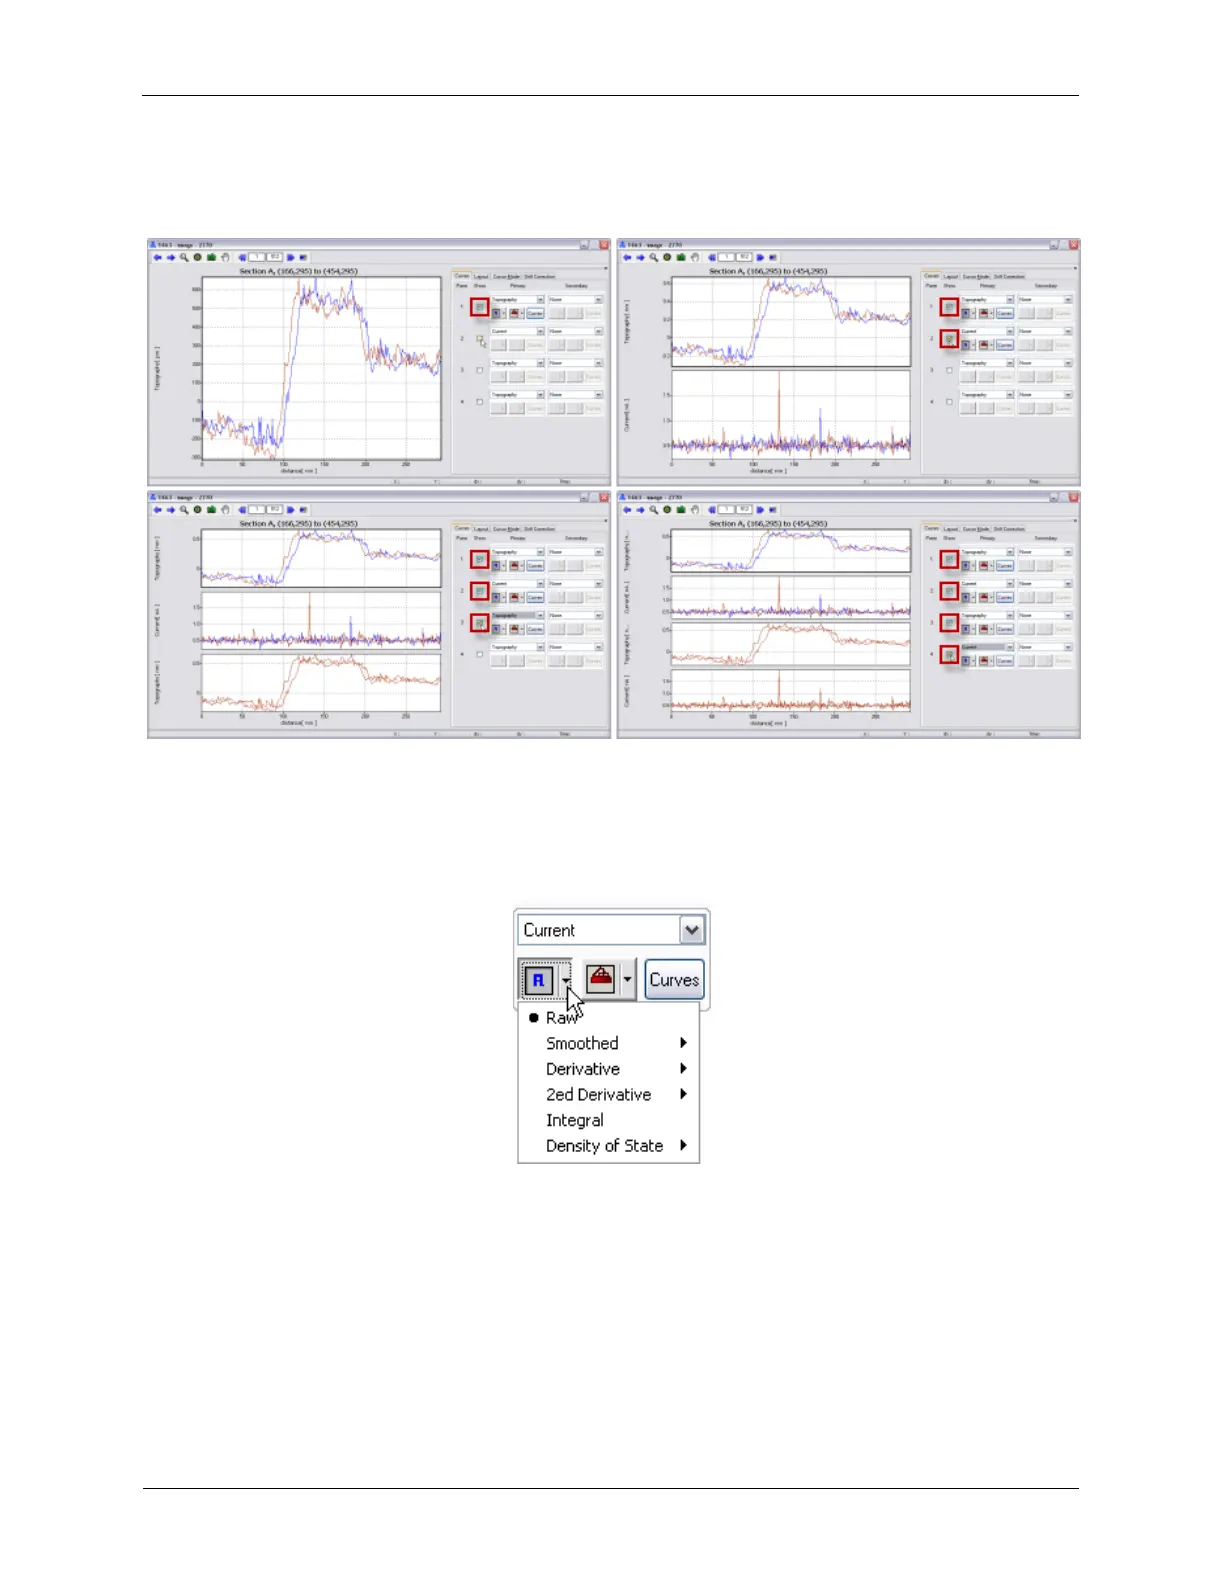
Figure K.23. XY Graph Settings - Panes
K.2.2.1.1 Show
Up to 4 data sets can be viewed on different panes in an XY Graph Window at the same time. Each pane
can display the same or different data as other panes. Each pane can be viewed with different settings.
K.2.2.1.2 Preprocessing Modes
Figure K.24. XY Graph Settings - Preprocessing Modes
The XY Graph Window has several preprocessing modes that can be previewed by moving the mouse
cursor over the different modes. The preprocessing modes are Raw, Smoothed, Derivative, 2nd
Derivative, Integral, and Density of State.
• Raw: displays the original, unmodified data.
• Smoothed: numerically smooths the data by interpolating a certain number of points.
• Derivative: numerically calculates the derivative of the data by using a certain number of points.