Display and Analyze your Image
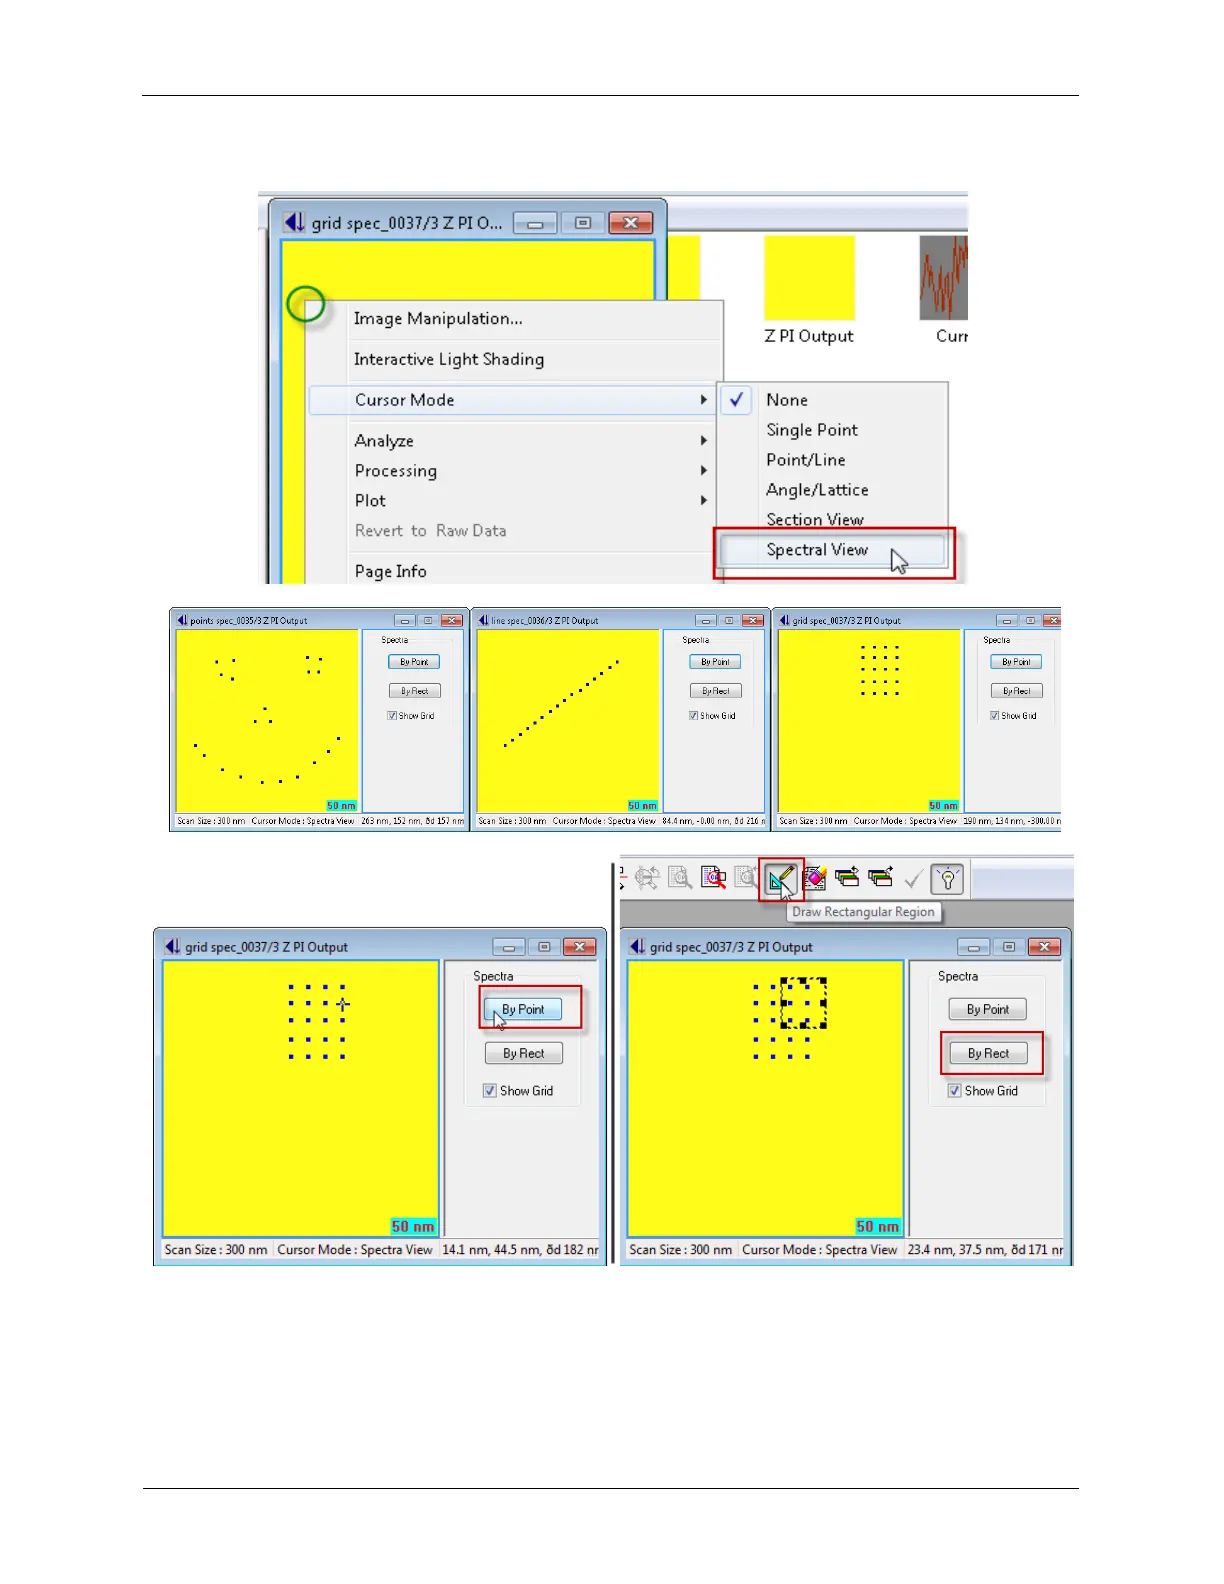
Figure 5.6. Image+Spectroscopy - Display Spectral Data
● To display the spectral data at a specific point, left-click the spec location and select By Point.
● To display the spectral data within a region, select the Draw Rectangular Region from the
toolbar, left-click-and-drag on the image to draw the region, and select By Rect.