Acquire Spectroscopy Data
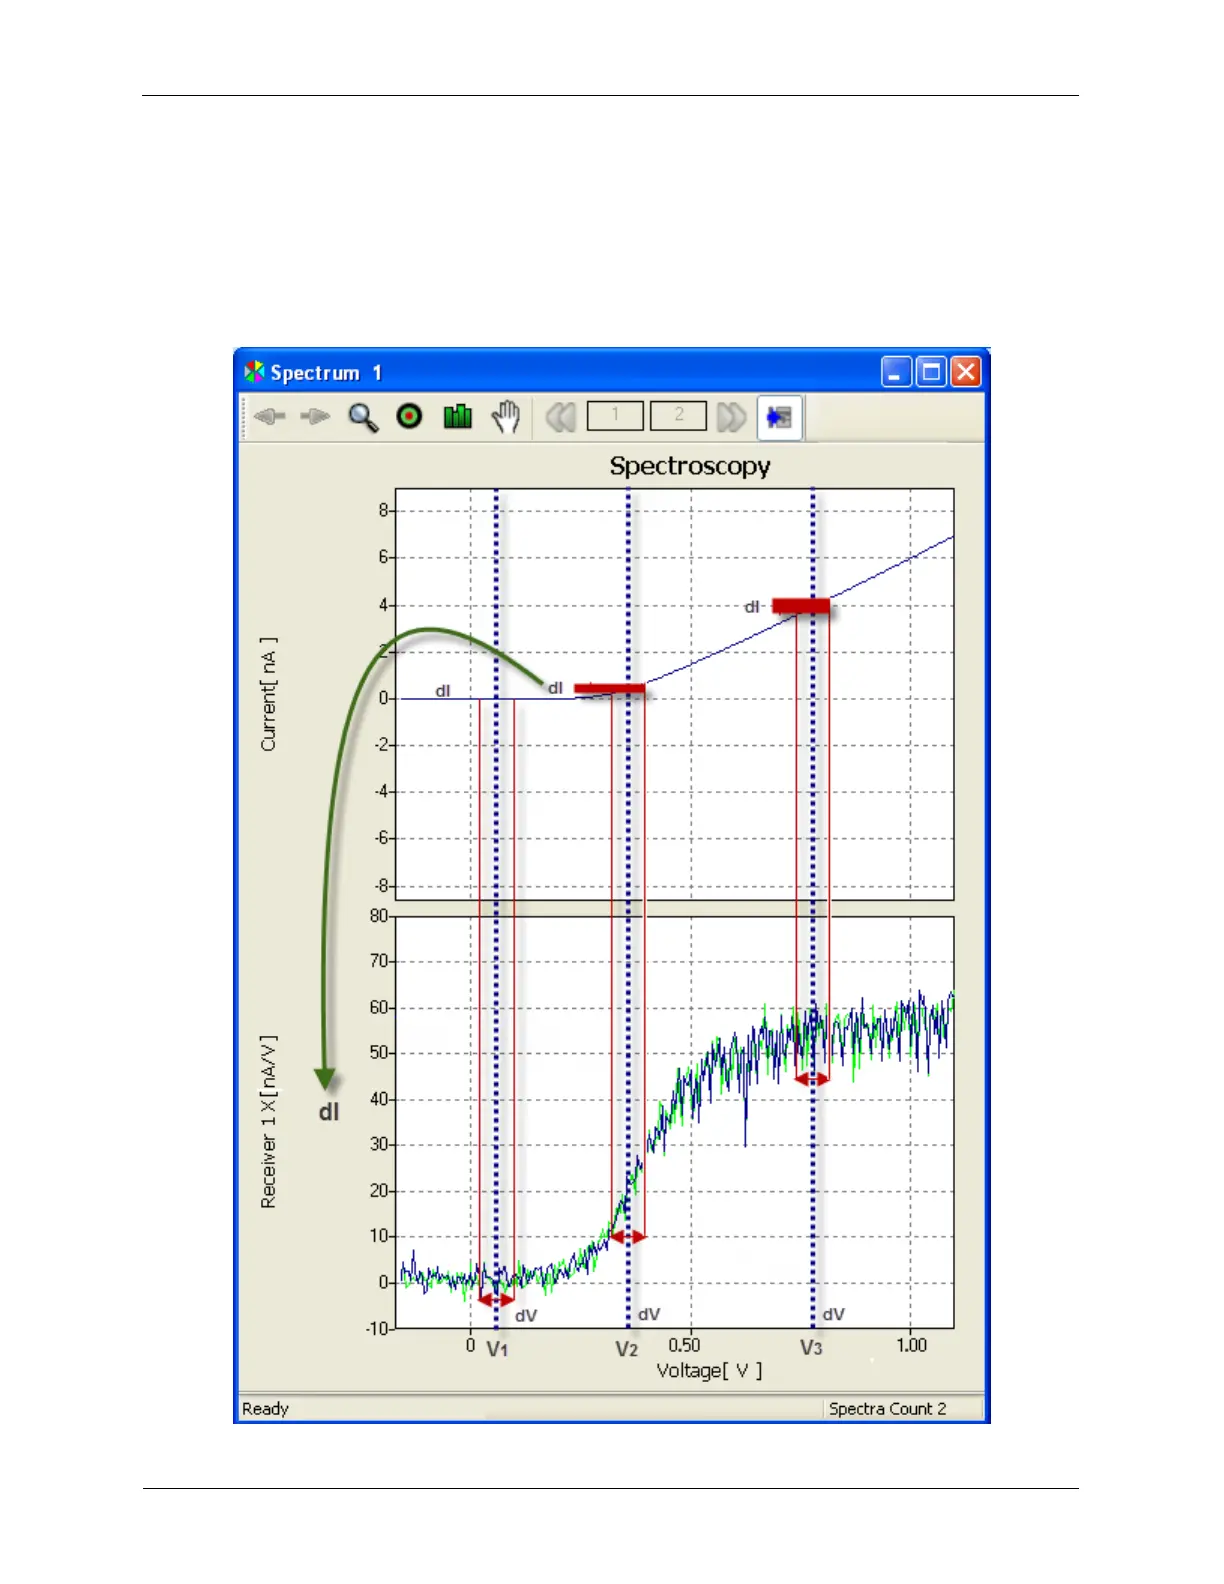
Voltage, V1, there is no slope to the I/V curve so dI/dV is zero, so the dI is zero here and but for the
noise, the dI/dV curve is zero. For the second Bias Voltage, V2 there is a positive slope to the I/V curve
and the same Oscillation amplitude added to this Bias Voltage will give a small change in I indicated by
the thickness of the red line. Finally, for Bias Voltage V3, the slope of the I/V curve is greater, but
becoming constant so the thickness of the red line is greater and the dI/dV curve is at a higher level, but
not increasing much.
Figure 6.13. Pictorial representation of dI/dV