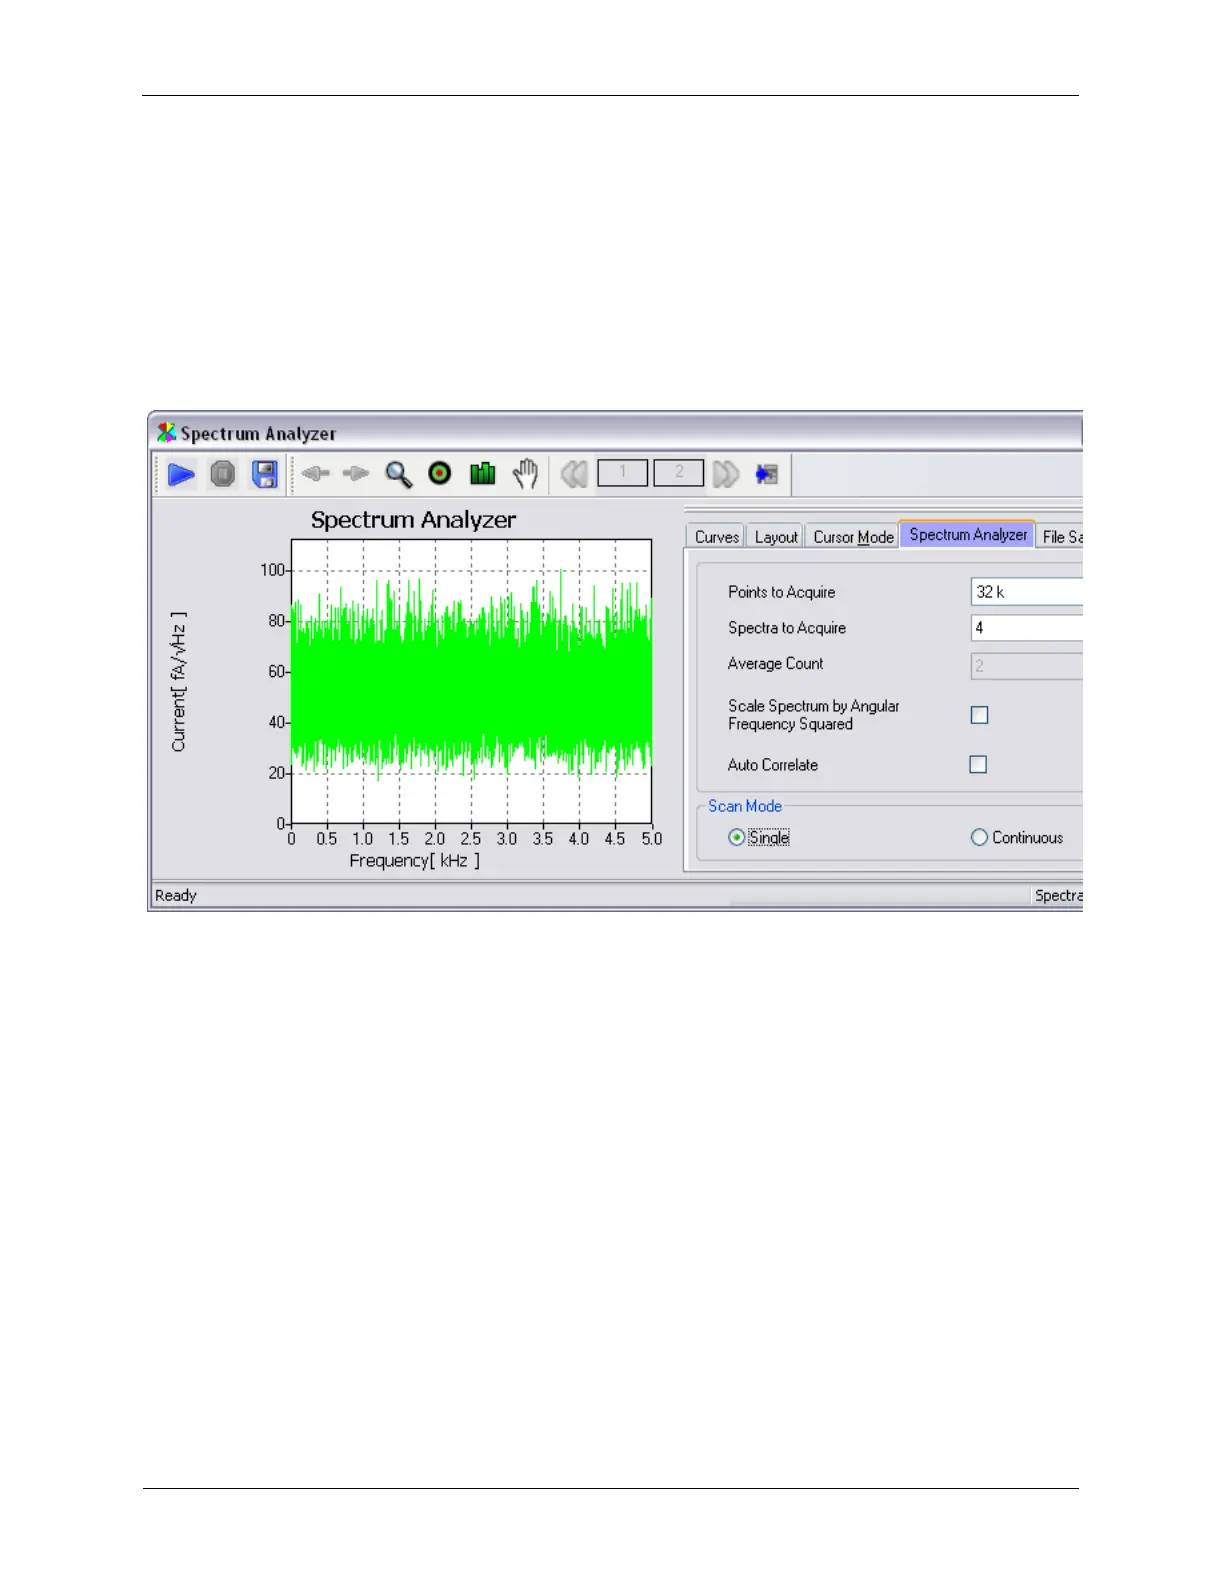
4. Under the Spectrum Analyzer tab, set the controls as follows: Points to acquire: 32K, Number of
spectrum: 4, Single/Continuous: Single.
5. Press the blue Start button on the Spectrum Analyzer.
A typical power noise spectrum is shown below. This shows the noise floor of the preamplifier. This is not
a precise measurement due to the limited number of samples acquired. A more precise measurement
can be performed by acquiring more spectra that are averaged together as well as increasing the number
of samples. The only disadvantage of taking a more precise measurement is more time is required.
Figure 1.16. Spectrum Analyzer Result at Full Bandwidth
The R9 input circuits have programmable gain to allow the dynamic range of the ADC to be matched to
the signal levels that will be encountered during the experiment. By default, the input gain of the Channel
2 ADC is set to 1. This allows a signal from - 100 nA to + 100 nA to be measured. If the typical currents to
be measured are not expected to be this large, the input to the ADC can be amplified. This will increase
the resolution of the measurement as the dynamic range of the ADC will be spread over a smaller range
of current values.
To see this effect, select a value of 8 from the Channel 2 ADC's input gain drop down box.
The signal on the Oscilloscope will now show more resolution than when acquired with an input gain of
1. Repeating the noise power measurements will also show lower noise. As the input gain is increased,
the amplitude of the signal that can be measured is decreased by the same factor. The full scale range
that can be measured is displayed in the Channel 2 input panel.
The above tests have been performed with the input circuitry at full bandwidth which is almost 20 MHz.
This is far higher than what is utilized for STM measurements. This wide bandwidth is primarily utilized for
AFM measurements. The R9 controller provides a filter that allows frequencies above the required range
to be removed in the digital domain. This filter is located in the ADC Channel 2 input panel.
From the drop down menu, select a 2 kHz filter with a roll off of 48 db. The decreased noise due to the
filtering will be immediately apparent on the Oscilloscope trace. Repeat the Spectrum Analyzer test
and the roll off in the noise centered at 2 kHz will be apparent.