Select Interactive Points from the Spectroscopy menu and left-click on the image to place the spectral
locations. A happy pattern is shown below.
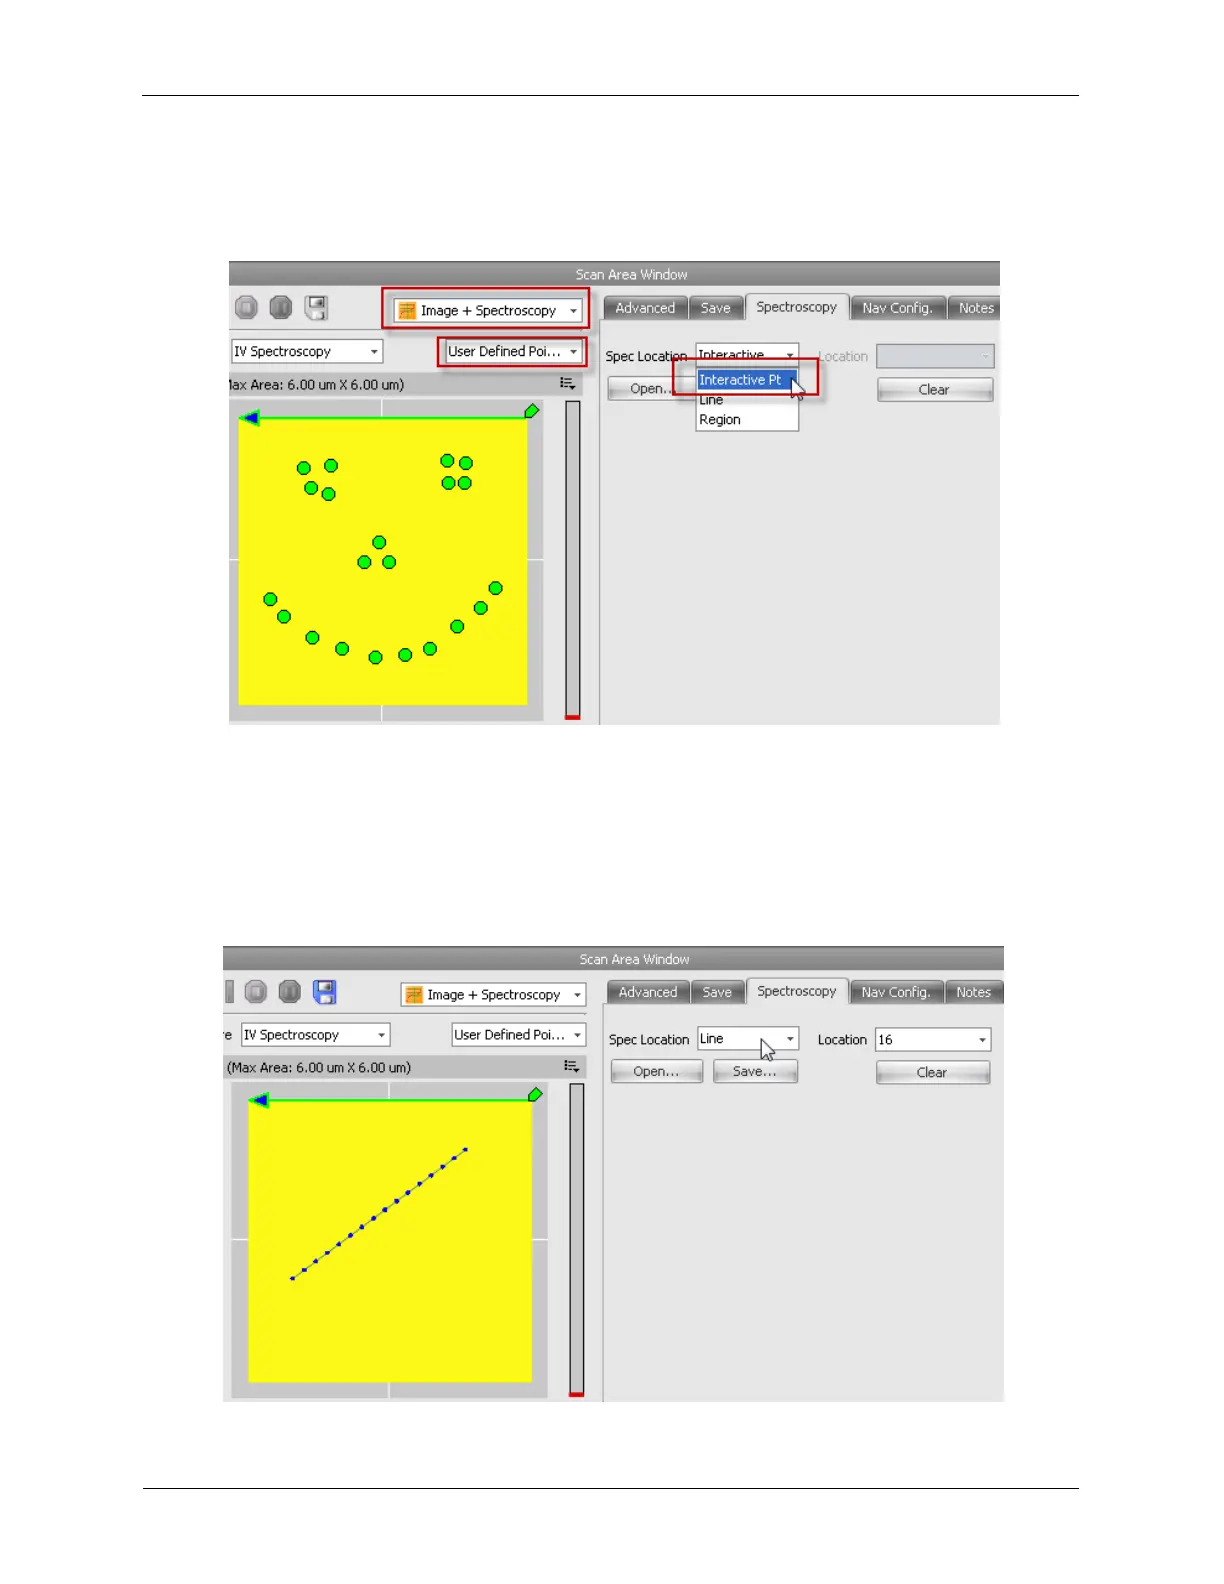
Figure 4.11. Image+Spectroscopy - Points
4.6.2 Line
The software can be configured to take spectroscopic data at locations along a line during image
acquisition. Select Line from the Spectroscopy menu and left-click-and-drag on the image to place the
line for the spectral locations. A line pattern with 16 spectroscopy locations is shown below.
Figure 4.12. Image+Spectroscopy - Line