4.6.3 Region
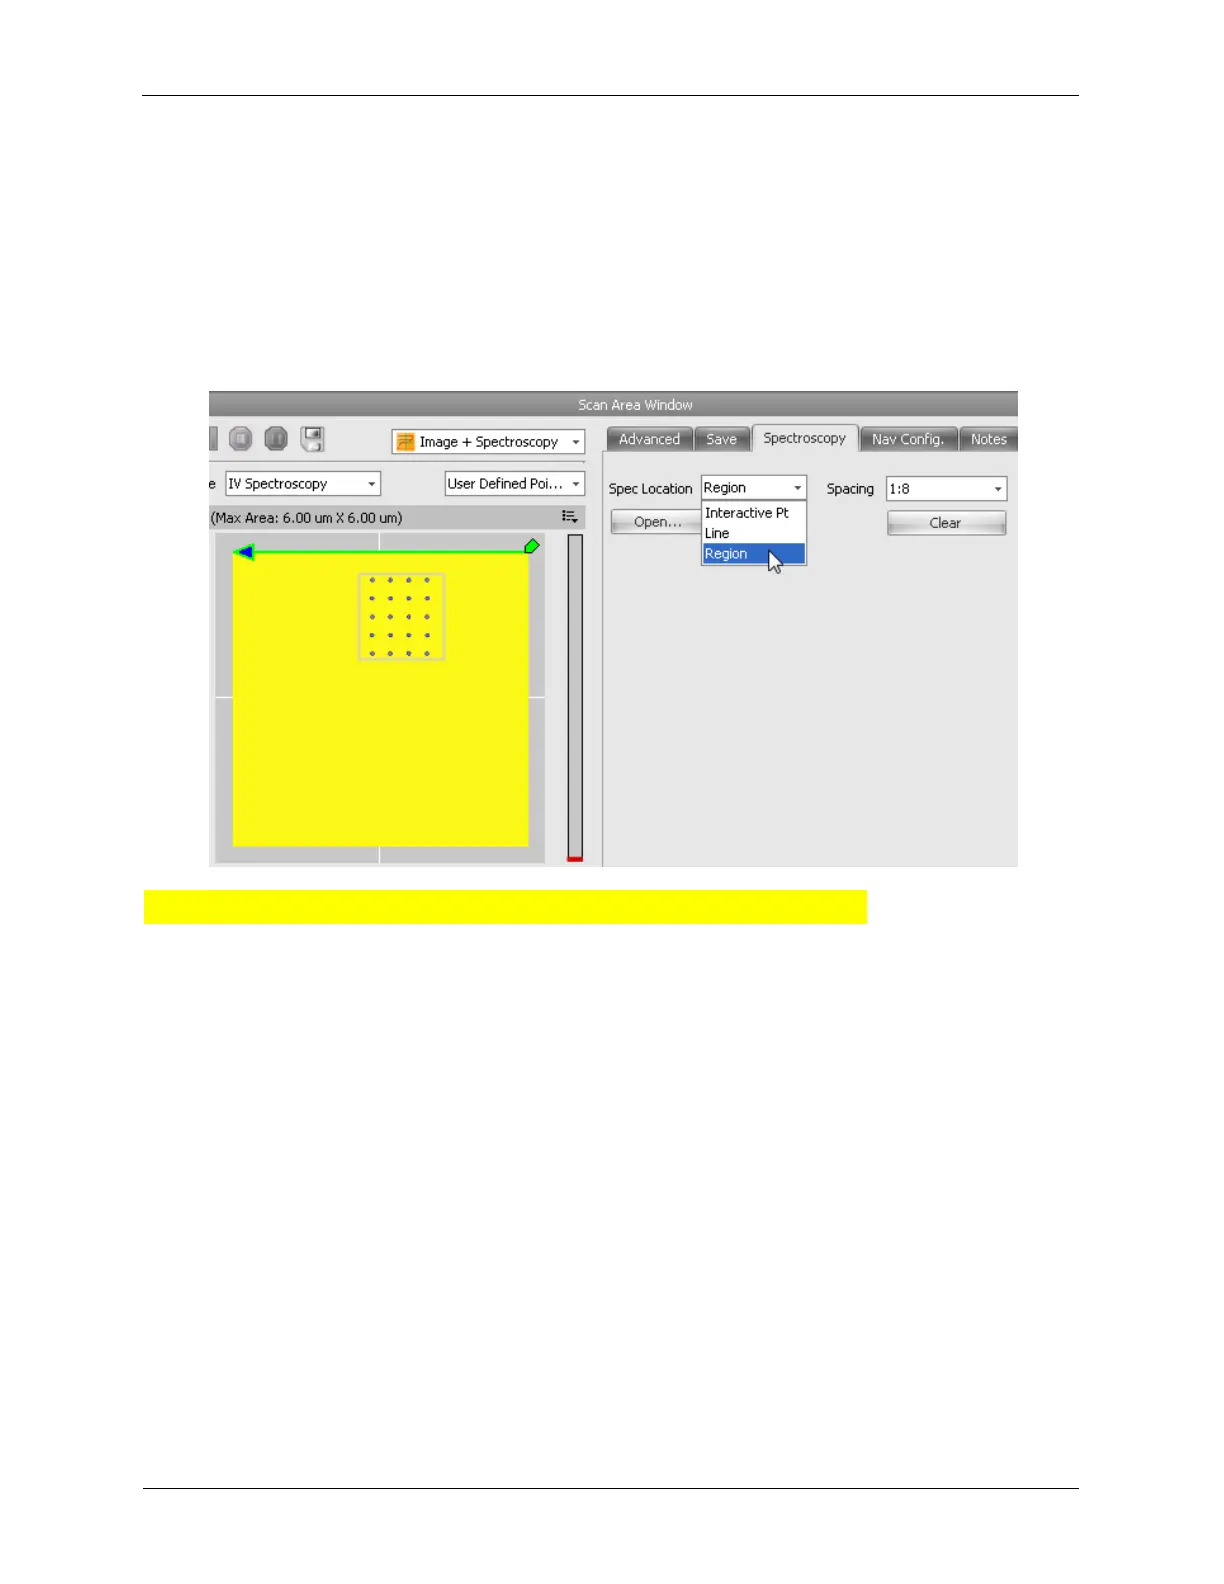
The software can be configured to take spectroscopic data at locations within a region during image
acquisition. Select Region from the Spectroscopy menu and left-click-and-drag on the image to draw the
spectral region. A region pattern with a 1:8 spacing is shown below.
Figure 4.13. Image+Spectroscopy - Region
4.6.4 Line Spectroscopy with Image Line Verification
The software can be configured to take spectroscopy at locations along a defined line. Before and after
acquiring the spectral data, the software will perform 4 line scans along that line to confirm the location
and check for stability. Then the software can display this spectral data using the same method as the
Image+Spectroscopy files. That is, using the Spectral View as in the Image+Spectroscopy analysis.


 To Next Page