Figure K.18. XY Graph Toolbar - Autoscale
Selecting Autoscale will change the XY Graph Window's maximum and minimum XY boundaries to fit the
entire graph in the XY Graph Window's display.
K.2.1.5. Pan
Figure K.19. XY Graph Toolbar - Pan
The Pan tool can be used to move the XY Graph Window's view to a display a different section of the
data.
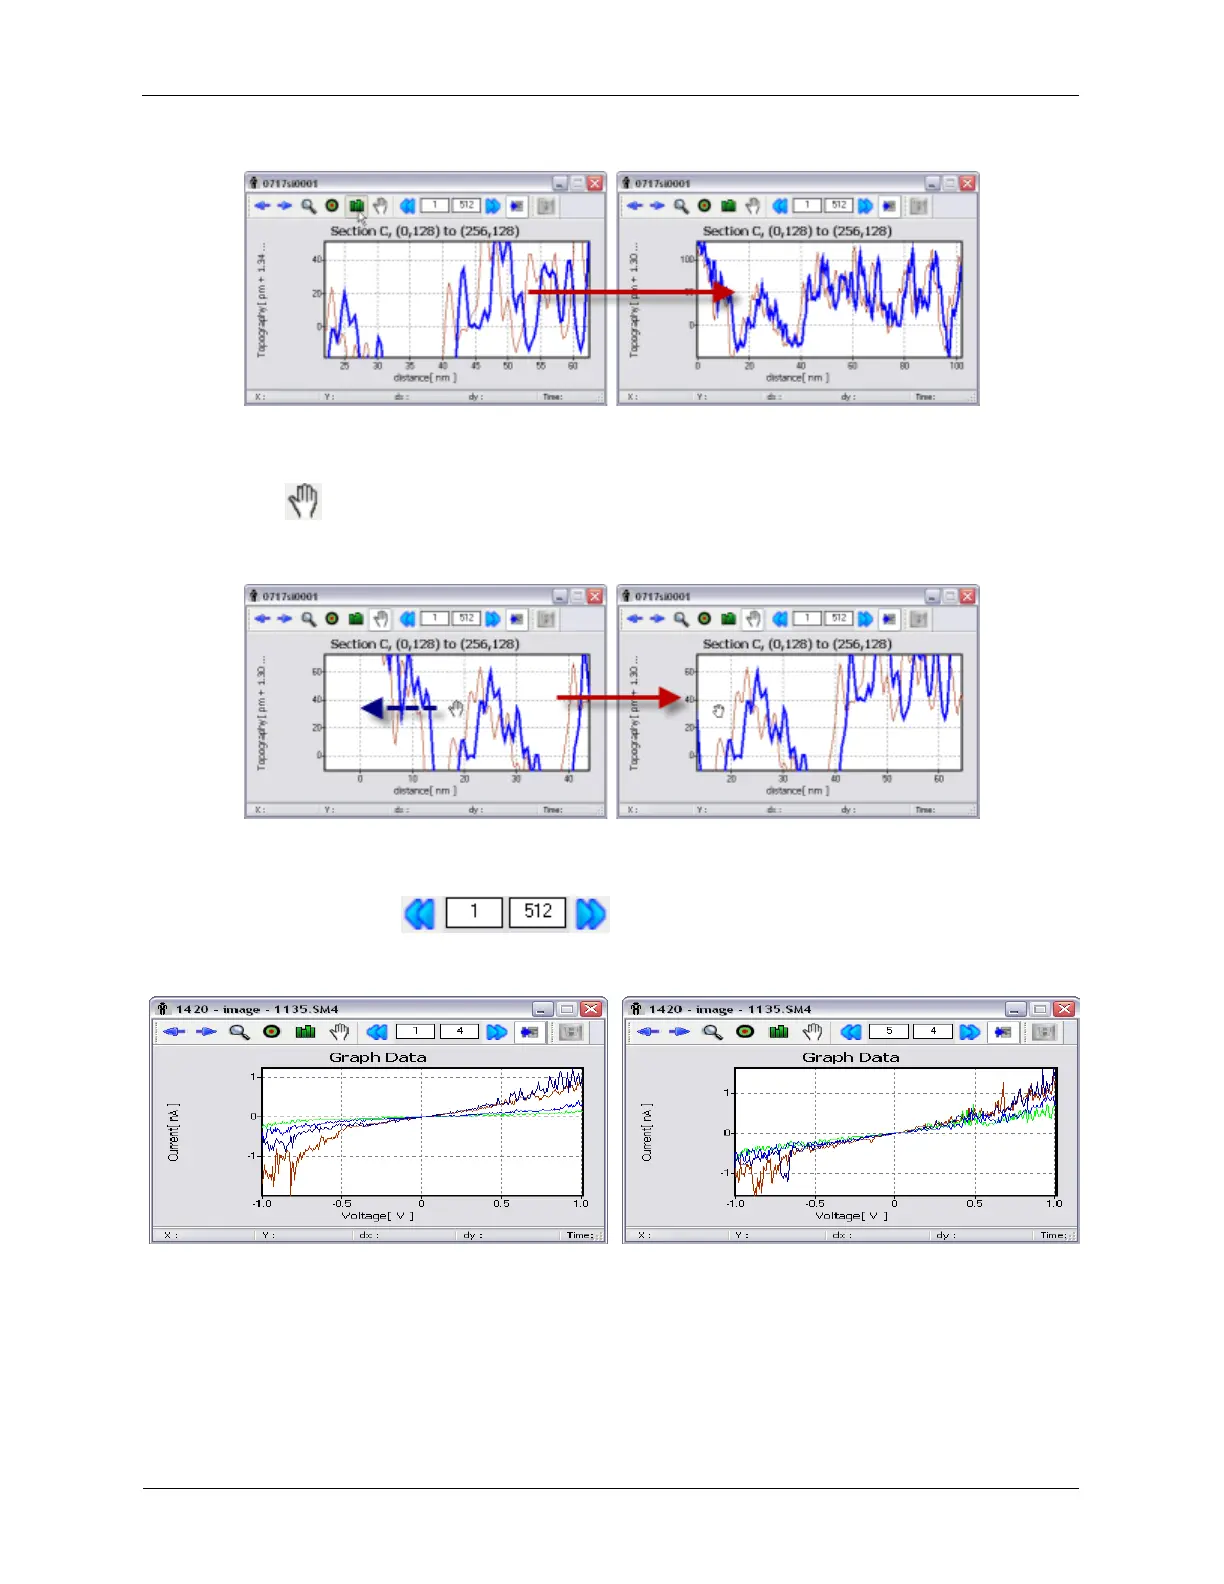
K.2.1.6. Curve Groups
Figure K.20. XY Graph Toolbar - Curve Groups
Data curves can be displayed in groups. The first number is the Curve Index, which will be the first curve
to be displayed. The second number controls the total number of curves in the display group. The Left
Arrow will select the Previous Curve Group and the Right Arrow will select the Next Curve Group.
For example, in the figure above 4 curves are visible beginning with curve 1. Pressing the Next Curve
Group button will show 4 curves beginning with curve 5.