K.4.1. Settings
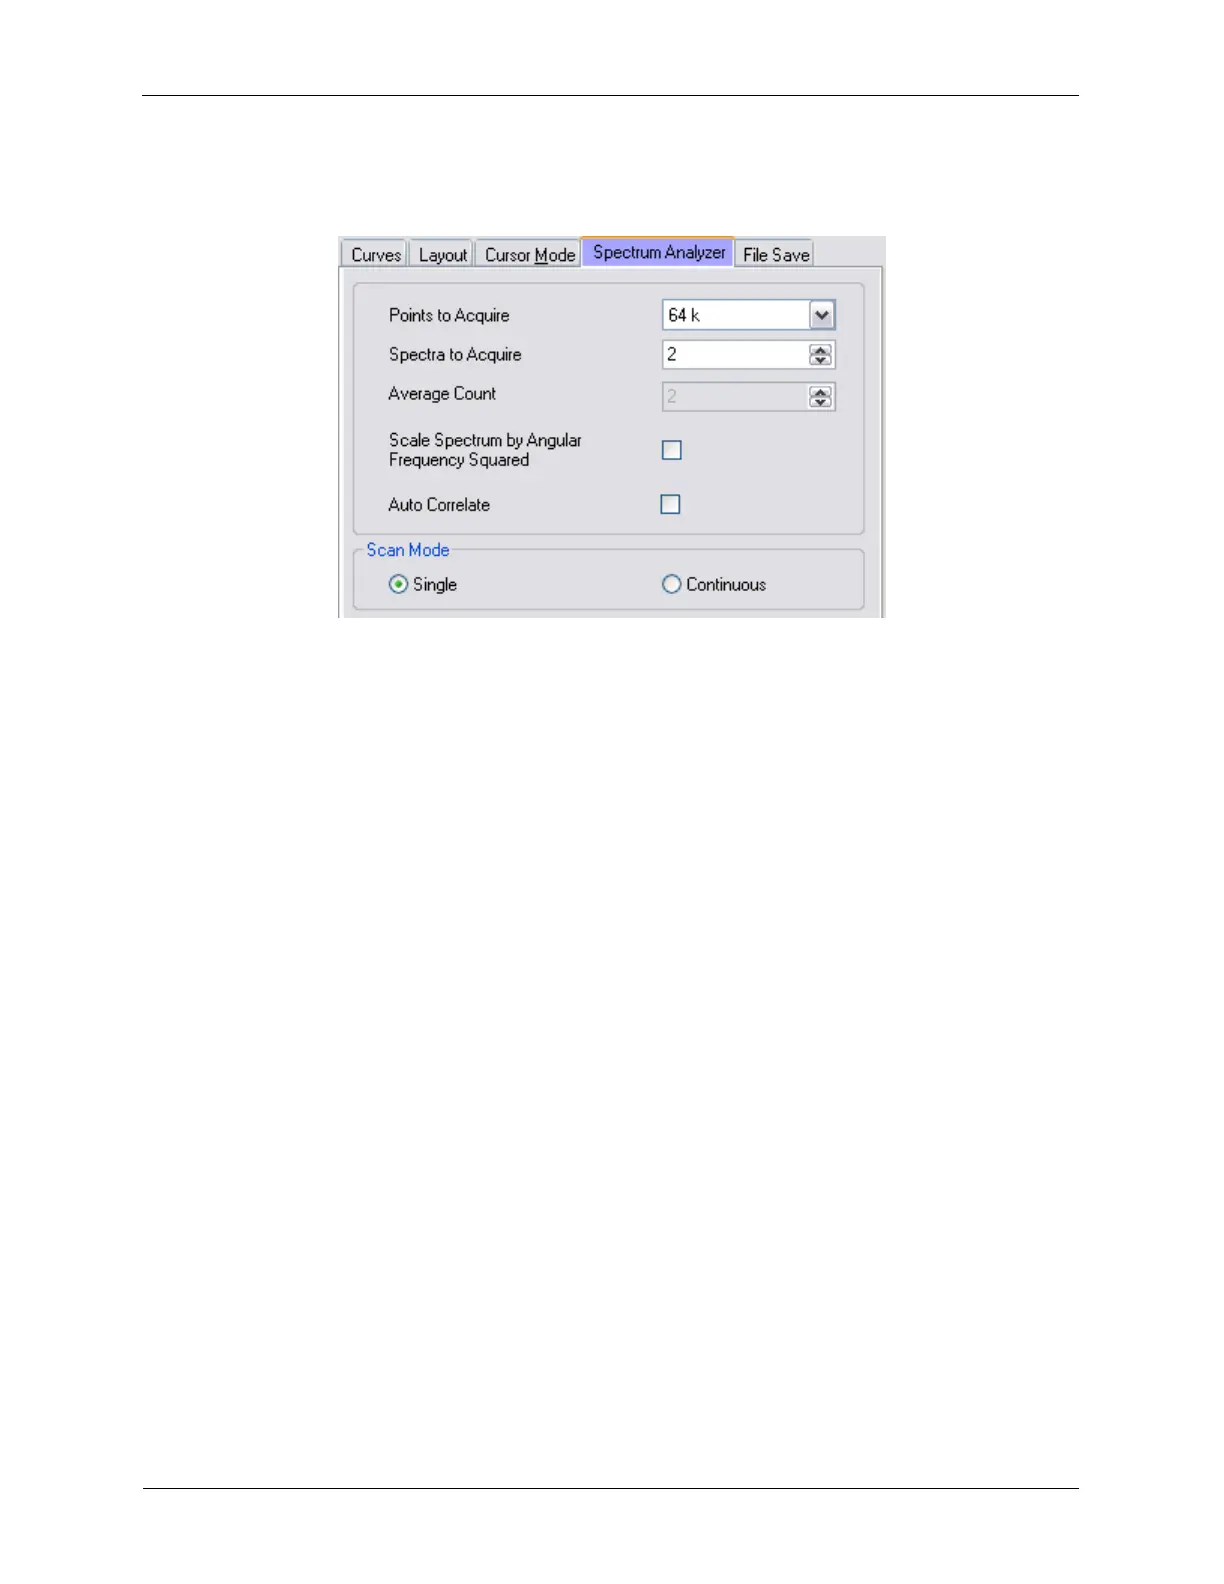
Figure K.33. Spectrum Analyzer Settings
The Spectrum Analyzer settings can be changed to fit the needs of the measurement.
• Points to Acquire: determines the frequency interval. Also directly affects the time required to acquire
the spectral data.
• Spectra to Acquire: controls the number of FFT curves to average together when using Scan Mode -
Single.
• Average Count: controls the number of FFT curves to use for the running average when using Scan
Mode - Continuous.
• Scale Spectrum by Angular Frequency Squared: this can be checked if using an accelerometer to
measure the vibration environment. The displacement will be properly scaled because the conversion
from acceleration to displacement is achieved by dividing the measured voltage at each frequency by
the square of the angular frequency.
• Auto Correlate: enable this setting to acquire an autocorrelation spectrum instead of a frequency
spectrum.
• Scan Mode - Single: the software will acquire Spectra to Acquire FFT curves, showing the real-time
average as the data is being acquired.
• Scan Mode - Continuous: the software will acquire FFT curves continuously, while showing the real-
time running average of the last Average Count number of FFT curves acquired.
K.4.2. Common Usage
The Spectrum Analyzer is a very powerful tool to search for noise sources. It will sample any analog
signal at a specified rate then numerically compute the Fast Fourier Transform (FFT) when completed.
Any peaks in the spectrum indicate periodic noise in the signal; the source of this noise should be
investigated.
A few points must be kept in mind to properly interpret the data: