Acquire Spectroscopy Data
Figure 6.7. Dashboard for UHV300.ihl
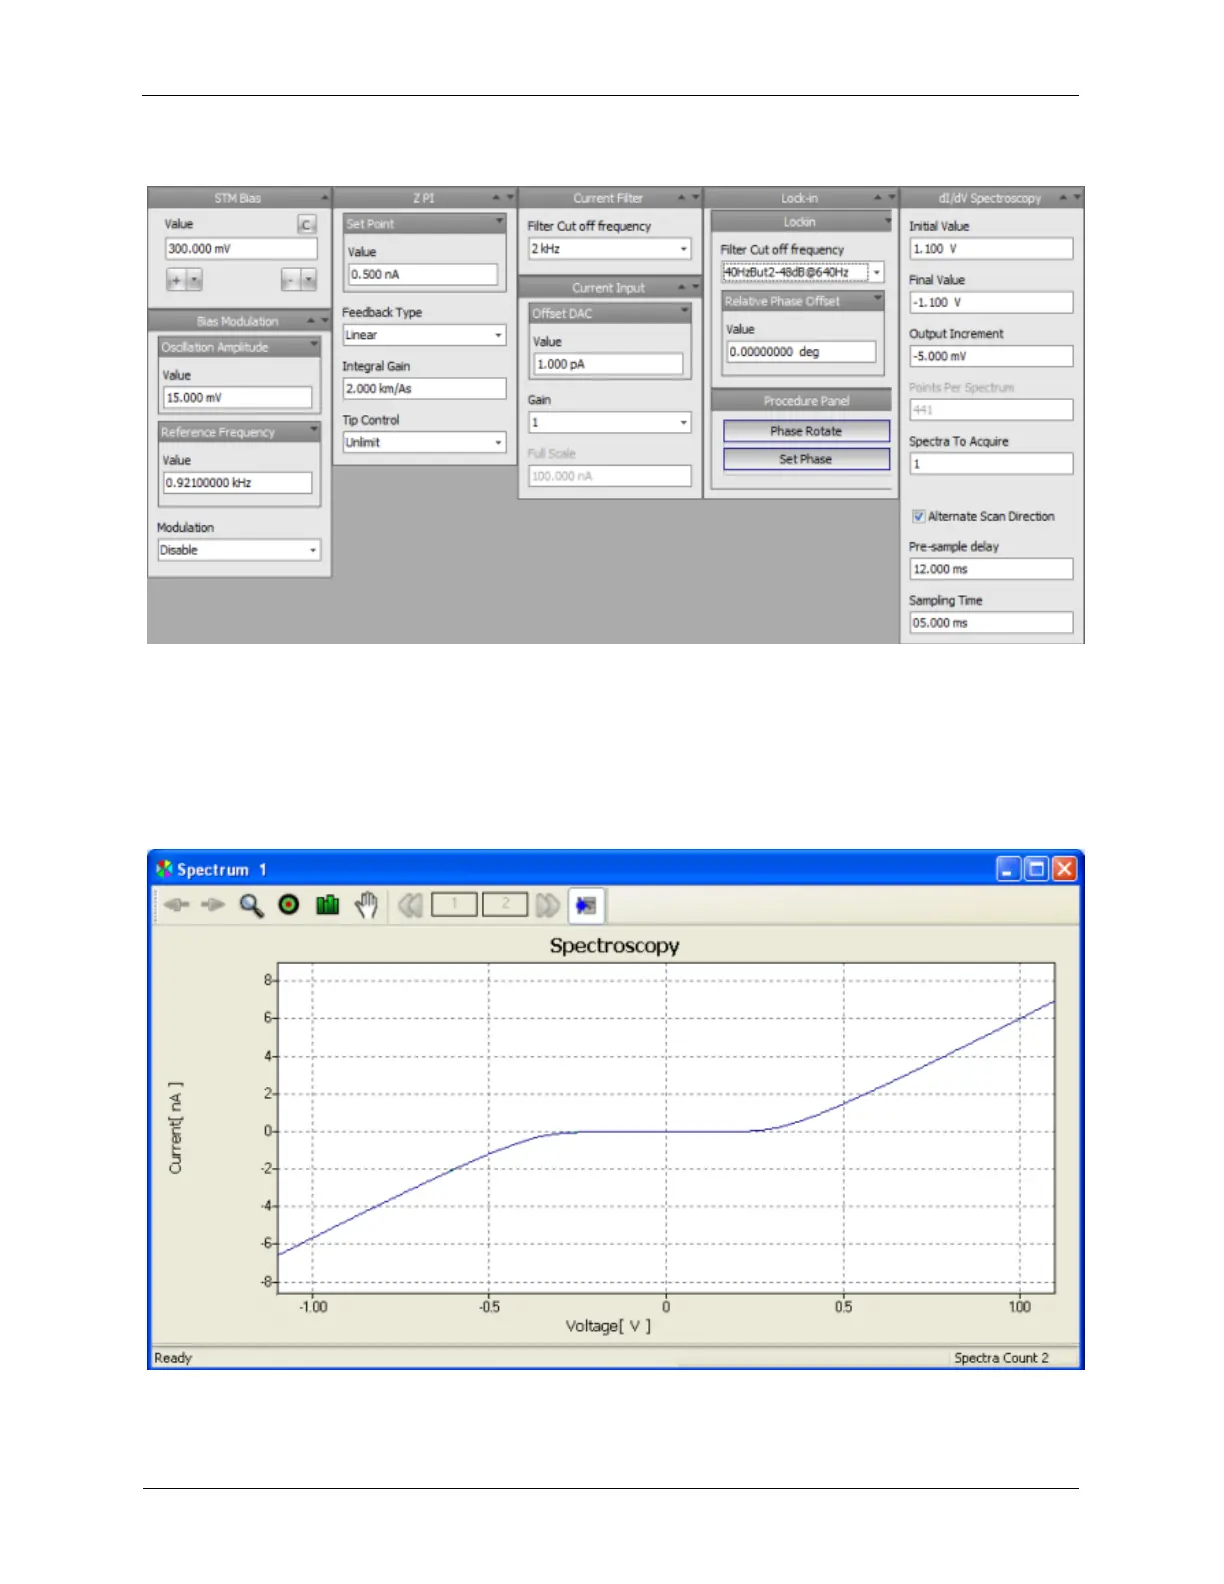
The dI/dV measurement will use the included dI/dV Spectroscopy or dI/dV Image Spectroscopy
procedures. It is helpful to perform the IV Spectroscopy procedure first as it will provide a basis for
setting the dI/dV Spectroscopy Settings for the dI/dV measurement. An IV Spectroscopy result is
shown below.
Figure 6.8. Example I/V Spectroscopy Measurement on a Pair of Back to Back
FETs
The following figure show the dI/dV Spectroscopy Settings and a schematic diagram. The FETs in this
example were 2N5486. They are low noise and low leakage current FETs with the Source and Drain