of the cantilever.
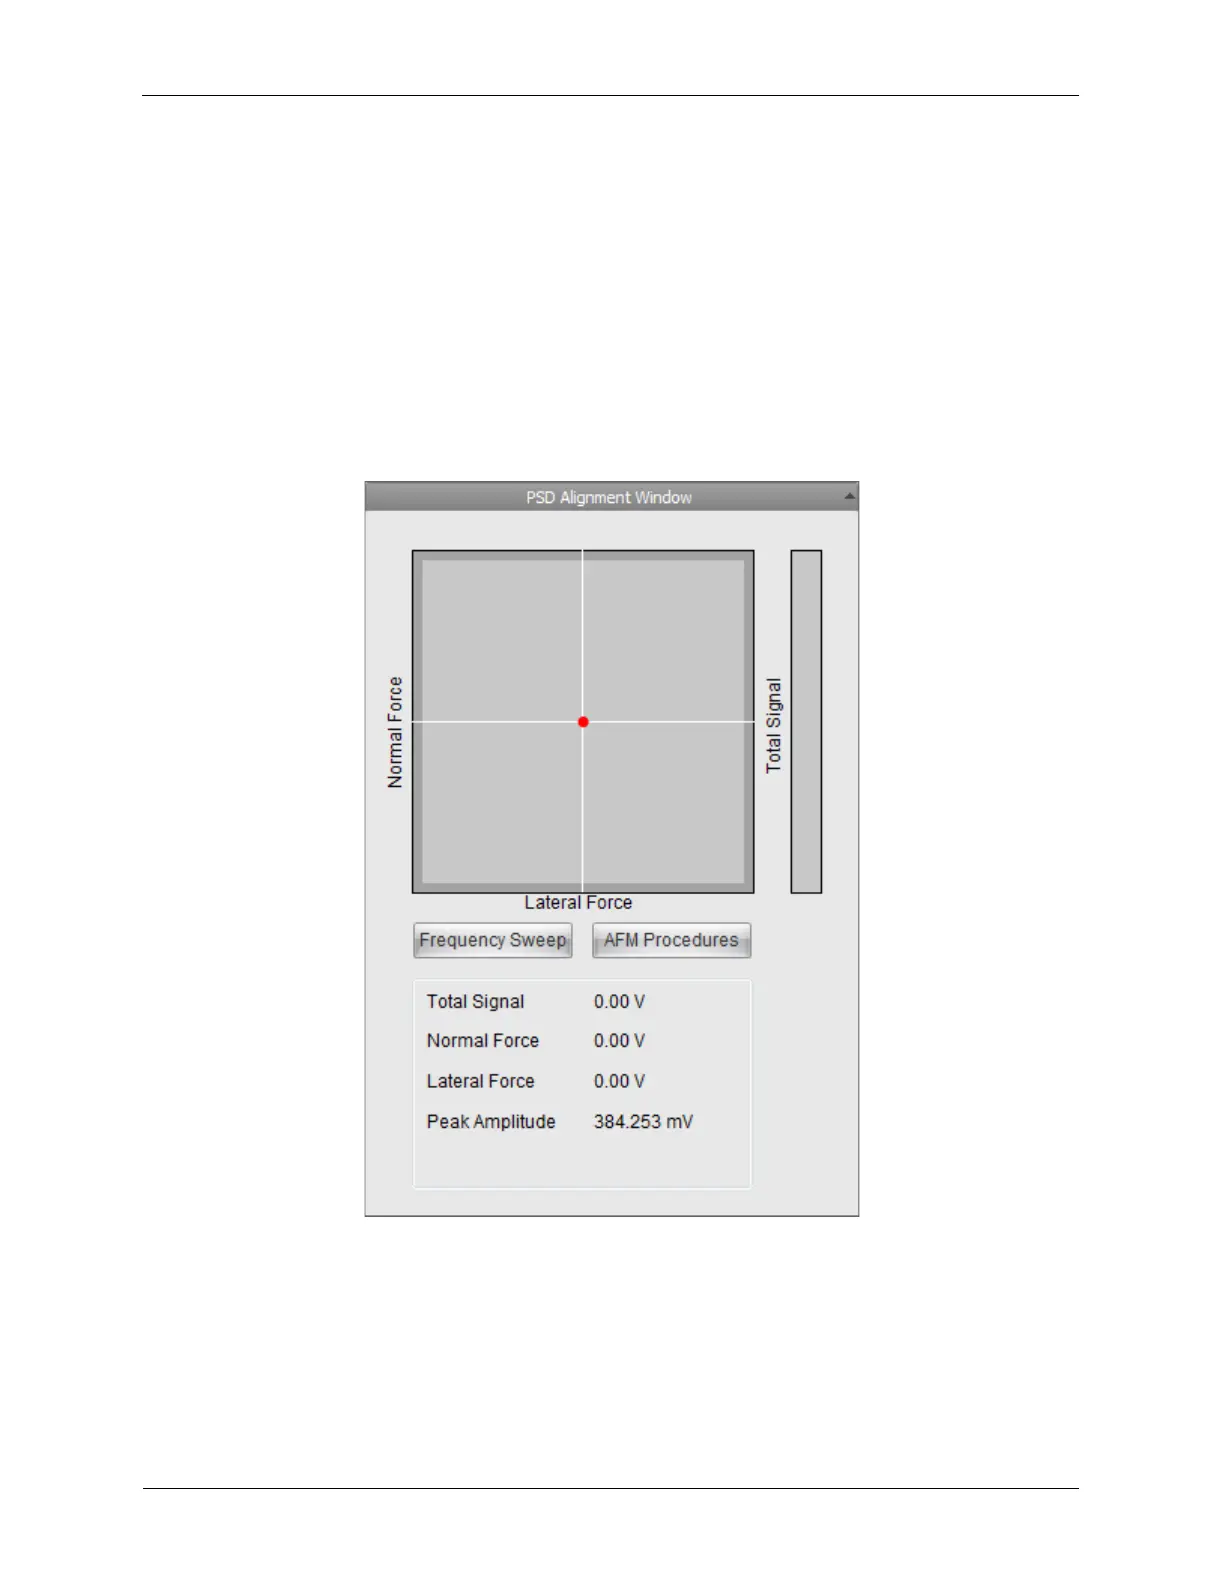
The PSD Alignment Window displays the laser intensities on each quadrant as a voltage. It also
displays calculated values for the Total Signal, Normal Force, and Lateral Force. The values are
calculated as follows:
Normal Force = (A1+A2)-(B1+B2)
Lateral Force = (A1+B1)-(A2+B2)
Total Signal = A1+A2+B1+B2
The Amplitude at the resonant frequency is shown as the Peak Amplitude.
Figure N.2. PSD Alignment Window
N.2. Frequency Sweeps
The Resonant Frequency (or frequencies) of a cantilever or tuning fork can be found by plotting
the LIA Amplitude and Phase outputs while changing the modulation frequency of the cantilever.
The LIA Amplitude should increase as the modulation frequency approaches a resonant
frequency. The resonant frequencies will appear as peaks in the LIA Amplitude in the Amplitude
vs. Frequency plot. The frequency widths of the resonant frequencies can be broad or narrow