Display and Analyze your Image
5.2.2 Filtering
High or low frequency noise in an image can be removed by the Smoothing filters. Smoothing filters are
based on averaging adjacent points in the image, such that normally higher frequency component of the
data is removed. Median filtering replaces extreme high or low points with median values of adjacent
points, instead of averaging them to eliminate the effect of individual noise spikes.
5.3 Displaying SPM Images
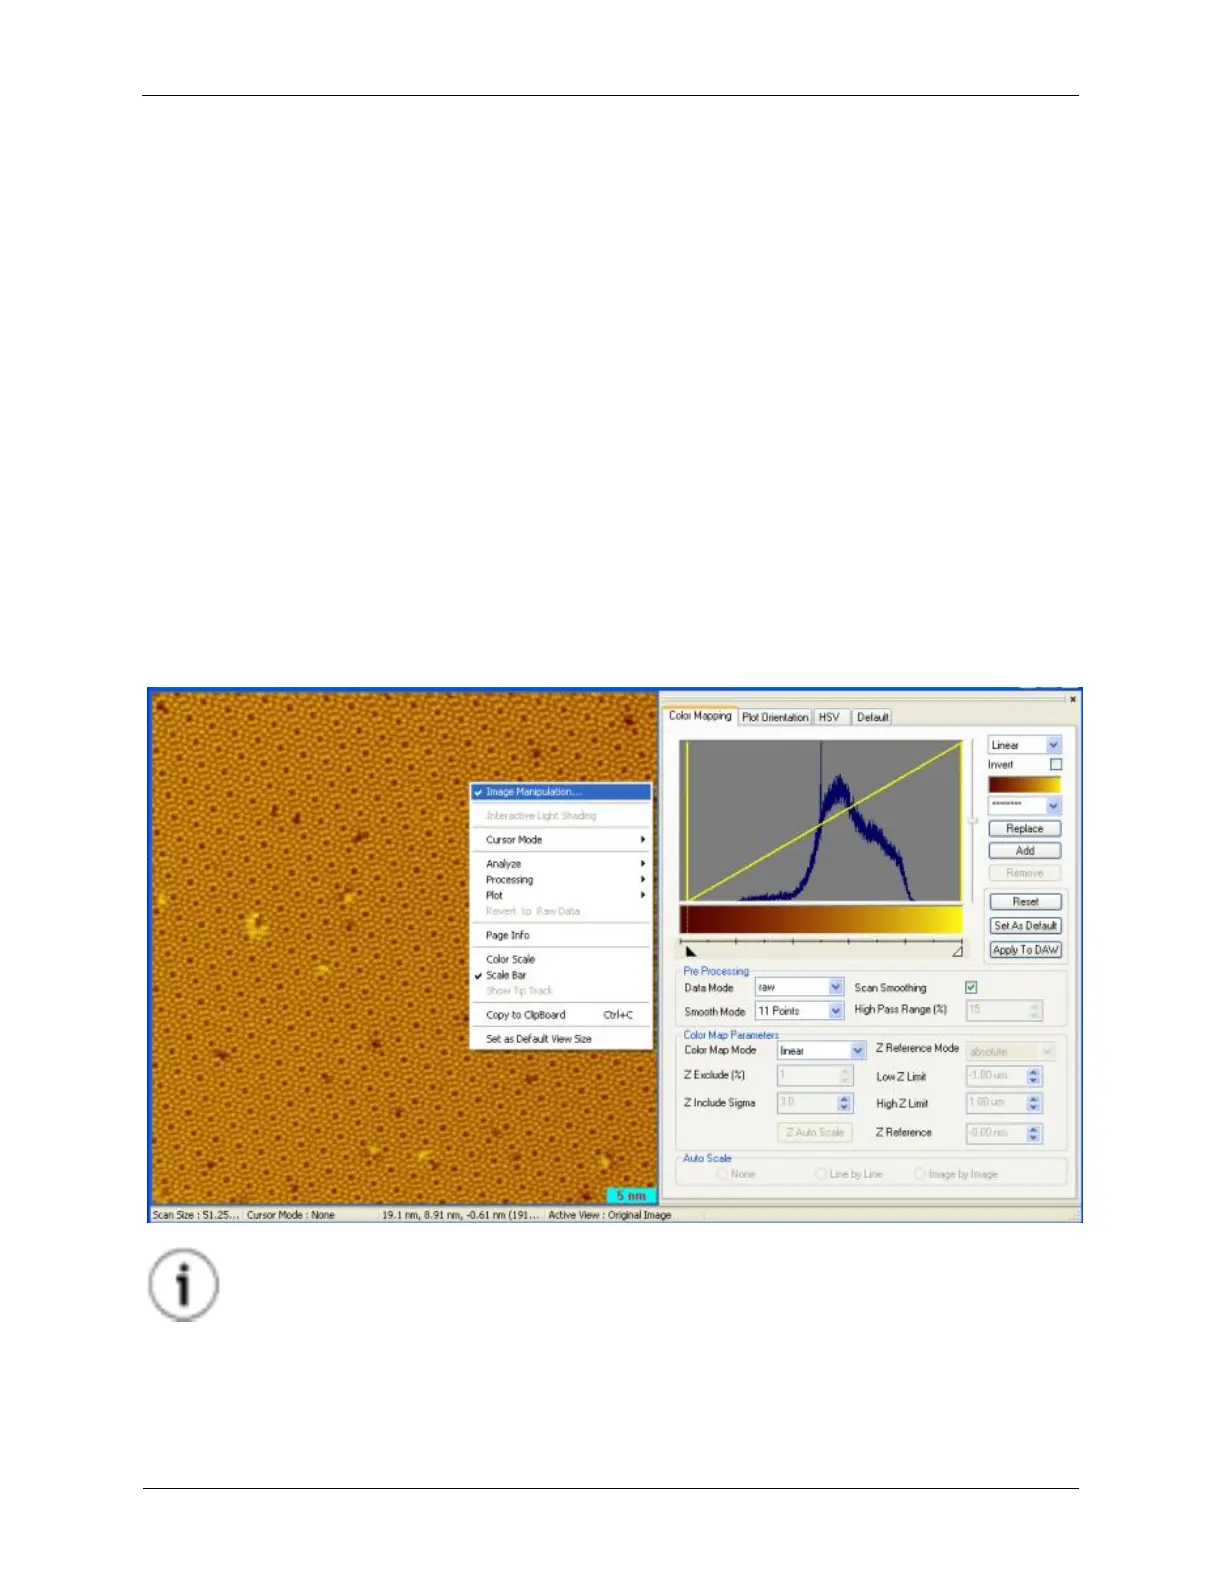
5.3.1 Image Manipulation
SPM is instrumentation that produces the bulk of its data in a three dimensional array of values, such as
height, current, force, etc. SPM data analysis software uses color mapping to assign shades of color to
represent these values in order for the human eye to grasp the data's information in the form of pictures.
Particular features can be enhanced or hidden to the viewer by changing the color map parameters.
Remember, such color mapping could assign the color shade to any physical value involved in a set of
data, such as topographic height or tunneling current. The R9 Browser grants the user a certain freedom
in manipulating the display parameters. One can find the Image Manipulation GUI interface by right-
clicking inside an image and selecting Image Manipulation... from the context menu.
Figure 5.3. Image Manipulation
Tip
Changing the Pre-processing Data Mode and Color Map Mode can make a big difference
in the image display. Using the line delta Z subtract Data Mode can help remove effects
caused by slight offset differences between each scan line. Using the limited Color Map
Mode helps improve image quality by ignoring noise spikes when calculating the color
map.