The Scan Area Window holds the controls for the Scan Generator. Depending on the construction of the
specific microscope, either the probe or the sample could be scanned. The Scan Area Window
components of interest are briefly explained below:
1. Acquisition Mode: This controls the Acquisition Mode. Set it to Image. Other choices, which will be
described later, include Spectroscopy and Image + Spectroscopy.
2. Scan Area Controls: These controls set the scan size, scan speed, and the relative position of the
current scan inside of the maximum scan area (field of view). These are good starting defaults for a
medium resolution image, or when looking for a clean section of a sample.
3. Zoom In / Zoom Out, Toggle Zoom, Pan: These controls are used to change how the scanned area
is being displayed. These controls do not have any effect on the actual scanning. Pressing the + and -
buttons will zoom out the display of the scan area window, but they will not change the size of the area
being scanned. In the same manner, pressing the hand icon and clicking on the image will allow the
display of the data to be moved around the SAW, allowing specific parts of the image to be zoomed in.
Again, this only controls the display of the data and does not change the size or position of the
scanning. Clicking again on the hand icon will turn off the PAN feature. The green circle icon is used to
toggle between a fully zoomed out view and a view zoomed around the Scan Area (Yellow Box). Press
this twice to zoom the Scan Area Window Display over the Scan Area (Yellow Box) as shown above.
4. Scan Area Window Display Control: This menu is used to set which imaging signal will be displayed
on the Scan Area in real-time during acquisition, and also used to set the visual range of the
Feedback Meter (located directly below the menu button).
a. Open the menu > Channel Image > Select Top: Z PI Output:Forward.
b. Open the menu > Select Z Bar Zoom Range: Set Z Range...
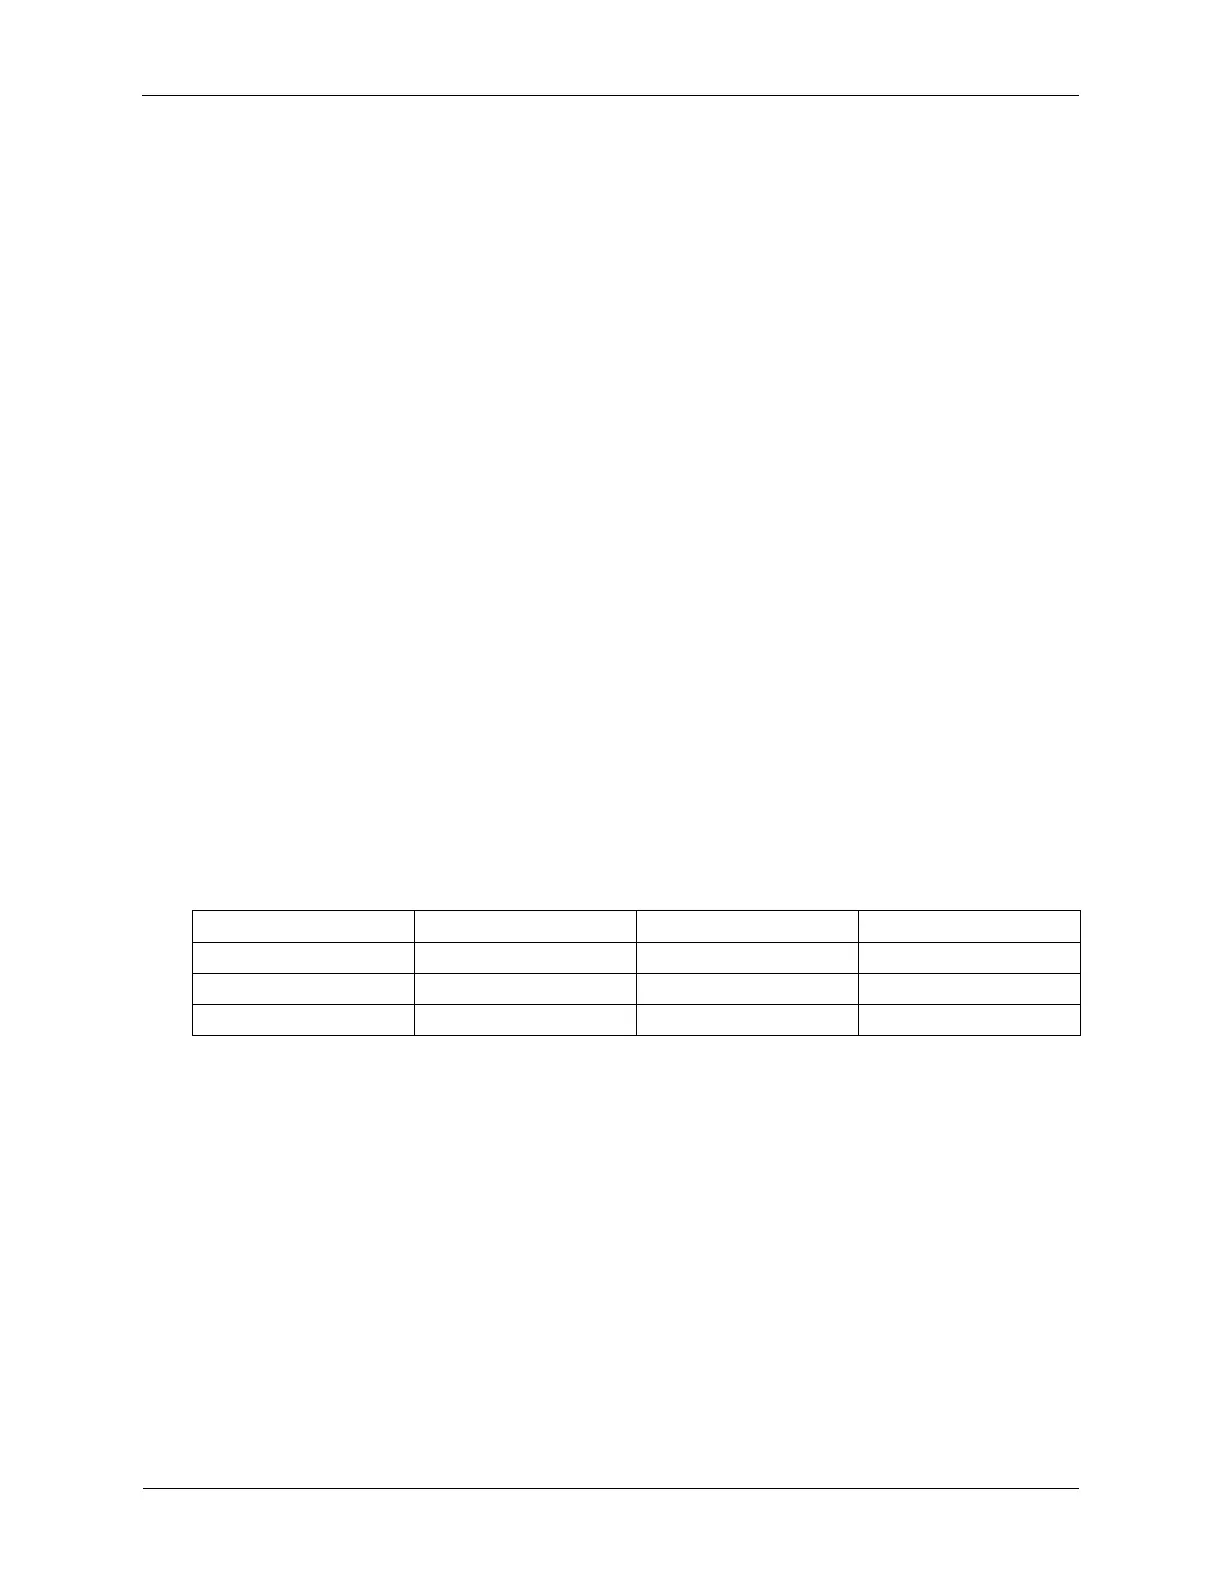
The table below shows example Z ranges for different high voltage gains on different RHK
microscopes. These values are calculated by multiplying the minimum and maximum high voltage
outputs by the piezo calibration.
Table 4.1. Z Bar Zoom Ranges
5. Config >>>: Press this to expand the Scan Area Window if it is not already expanded. Most of the
settings in the Configuration tab are set once and rarely changed. After setting these parameters, the
tab can be closed by pressing the configuration button again.
6. Advanced, Save: Check that the Advanced Settings and Save Settings resemble the following figure,
although the specific Save information is not as important.