made so the user does not have to modify the secondary graph color to distinguish it from the
Primary graph color. An example of where this is useful is the Image Line where the forward
and reverse traces are drawn on the same graph, but we would want to use different colors to
make them easy to see clearly.
K.3. Oscilloscope
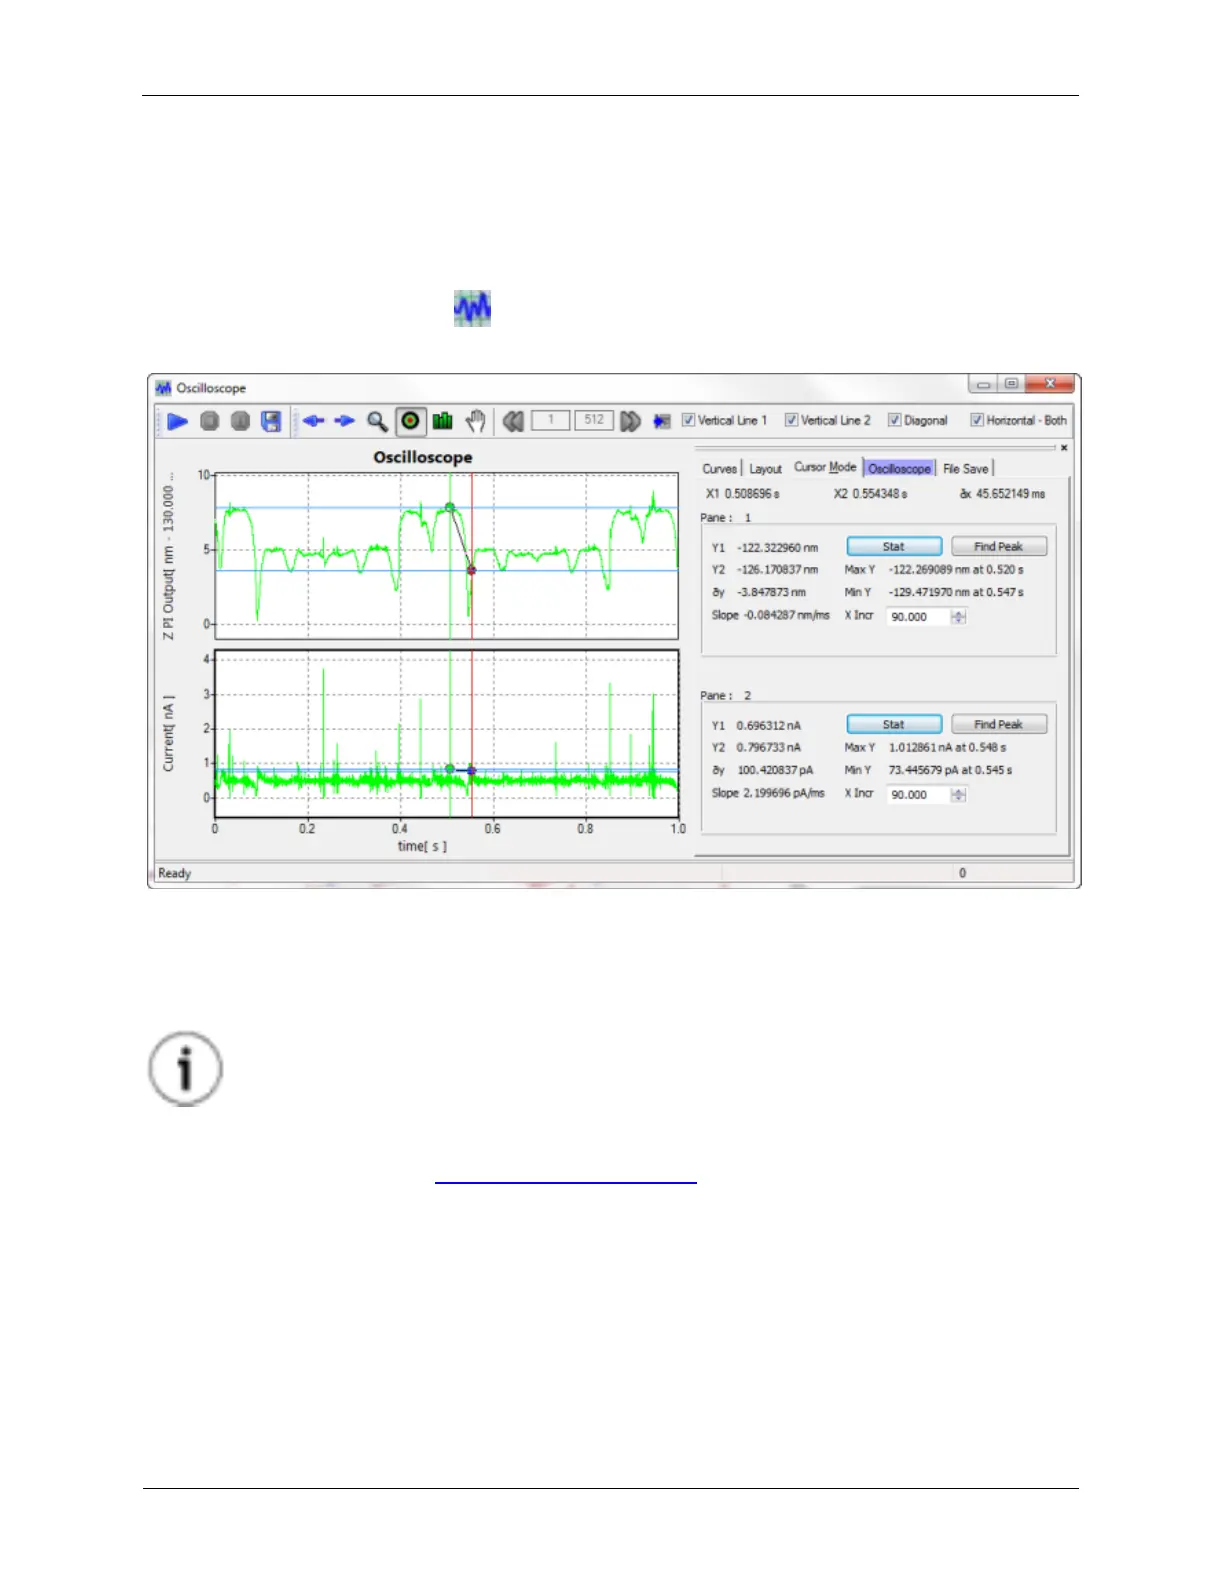
Figure K.30. XY Graph Oscilloscope
Many times it is advantageous to look at signals in the time domain instead of the frequency domain. A
better feel for the amplitude of the signal as well as quicker viewing of the data are two reasons worth
considering. Most of the time this will be done as a diagnostic to check signal levels, but there are also a
number of experiments where recording a signal as a function of time either as a response to a stimulus,
and to have a permanent record of the system at a specific time can be beneficial.
Tip
The Oscilloscope can be used while other experiments are being performed.
The Oscilloscope is an XY Graph Window so most of its controls will have the same function as other XY
Graph Windows. Please see the XY Graph Window Reference section for more information.
Signals that are connected to Measure Items in Hardware Space will be available for display on the
Oscilloscope. Up to four signals can be displayed on the Oscilloscope simultaneously. These signals can
be selected on the Curves tab.
K.3.1. Settings
Figure K.31. XY Graph Oscilloscope Settings