Configuration Guide 126
Monitoring Traffic Traffic Monitor
Packets Rx: Displays the number of packets received on the port. Error packets are not
counted in.
Packets Tx: Displays the number of packets transmitted on the port. Error packets are not
counted in.
Octets Rx: Displays the number of octets received on the port. Error octets are counted in.
Octets Tx: Displays the number of octets transmitted on the port. Error octets are counted
in.
Statistics: Click this button to view the detailed traffic statistics of the port.
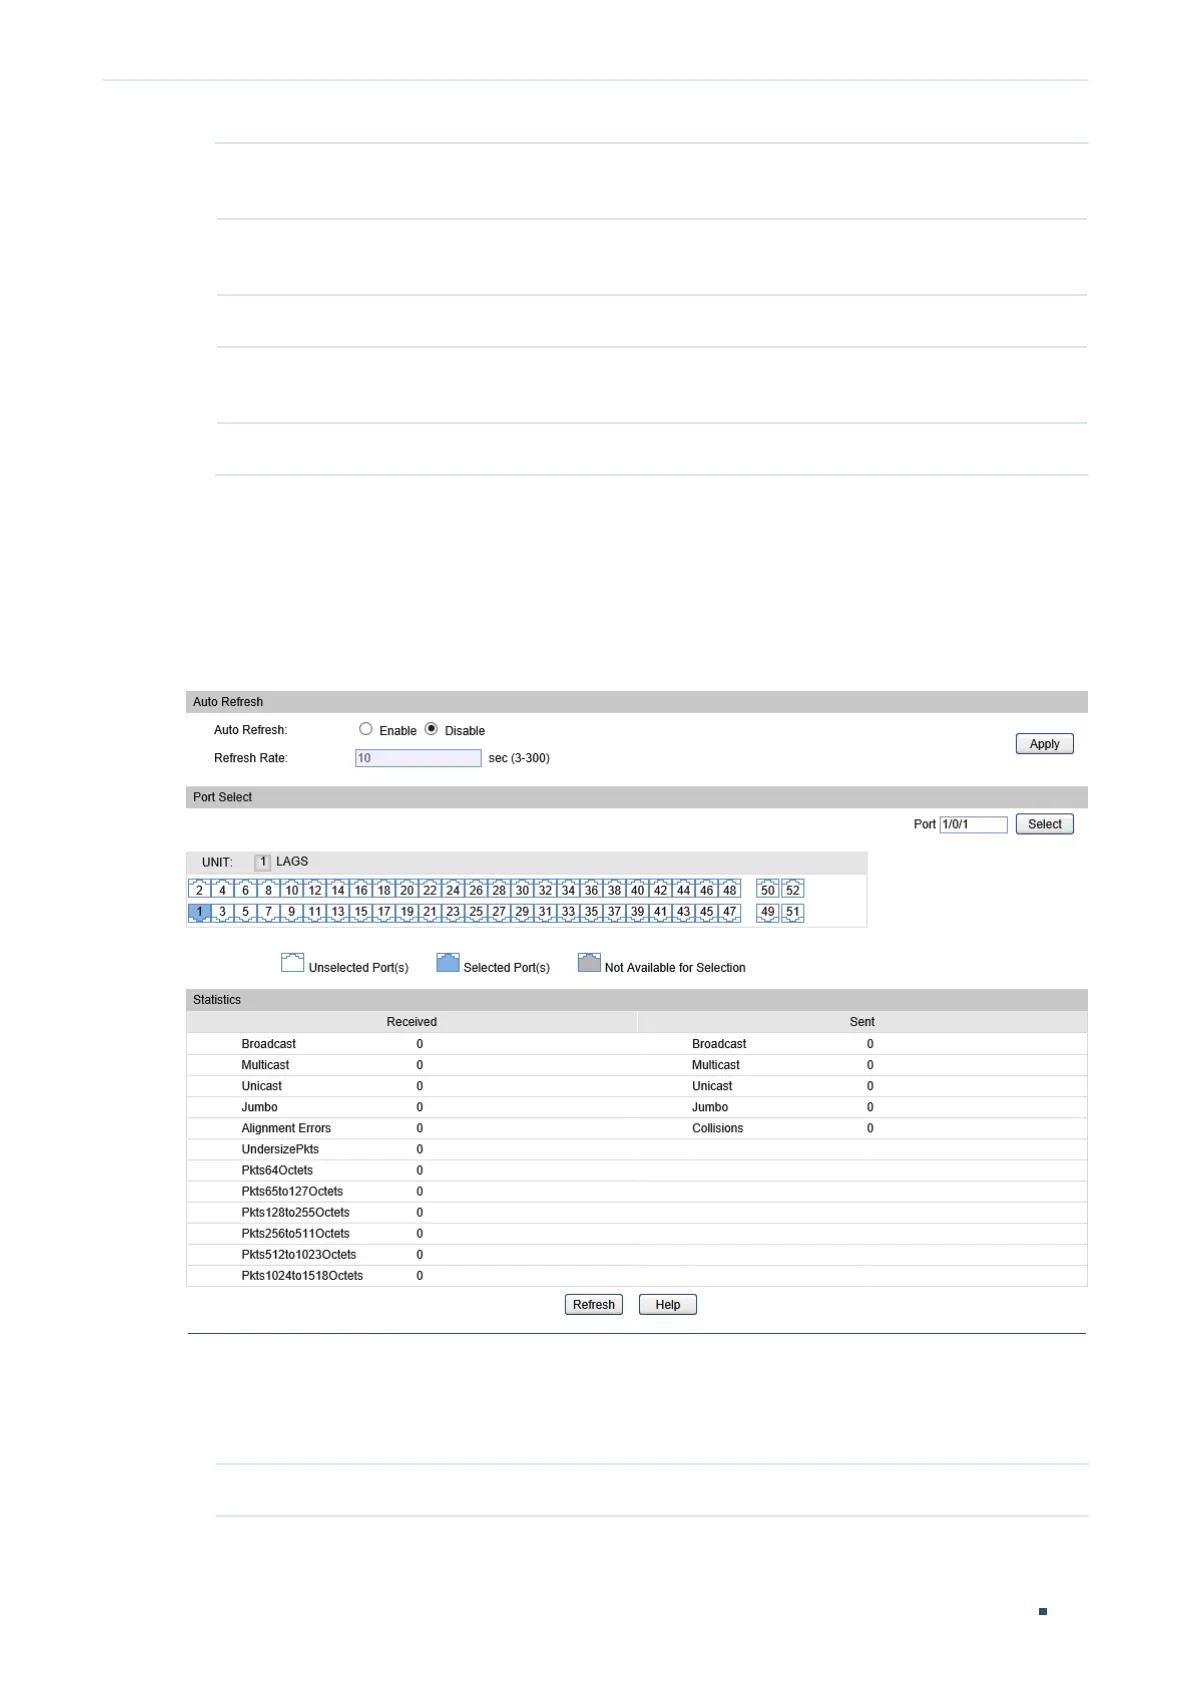
1.1.2 Viewing the Traffic Statistics in Detail
Choose the menu Switching > Traffic Monitor > Traffic Statistics to load the following
page.
Figure 1-2 Traffic Statistics
Follow these steps to view the traffic statistics in detail:
1) To get the real-time traffic statistics, enable auto refresh in the Auto Refresh section,
or click Refresh at the bottom of the page.
Auto Refresh: With this option enabled, the switch refreshes the web timely.