2: General operation Model DMM7510 7½ Digit Graphical Sampling Multimeter
2-40 DMM7510-901-01 Rev. B / May 2015
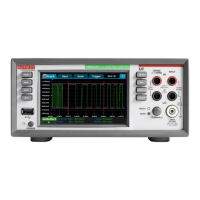
Scale tab
The Scale tab contains settings that allow you to fine-tune the output on the Graph tab.
Setting Description
X-Axis Method
The method determines how data is scaled and tracked on the
Graph tab. You can select:
• SmartScale: The instrument determines the best way to
scale data based on the data and the instrument
configuration (such as the measure count).
• Track Latest: The graph always shows the latest data.
• Track Group: The graph always shows the entire data group
on the graph.
• All: All data is displayed on the graph.
•
Off: The graph is not automatically adjusted.
X-Axis and Y-Axis
Scale
Sets the reading value scale for each division.
X-Axis and Y-Axis
Minimum Position
Sets the first value that is visible on the graph for the selected
trace.
Trace
Toggles between the available traces. Information specific to the
trace is shown in the same color as the trace.
Y-Axis Method
The scale method determines how data is scaled on the Graph tab.
If you are graphing one trace, you can select:
• SmartScale: The instrument scales the graph automatically.
The scale is set to fit all the data that is in the selected
reading buffer onto the screen. The instrument determines
the best scale based on the data.
• Off: No automatic resizing occurs. You can adjust the data
manually by swiping, pinching, and zooming.
If you are graphing multiple traces, you can select:
• SmartScale: The instrument scales the graph automatically.
The instrument determines the best scale and tracking
method based on the data, reading groups, number of
traces, and instrument configuration.
• Per Trace: Each trace is displayed on the graph.
• Lanes: Each trace is displayed in a separate partition of the
graph. When the Lanes option is selected, there are no
measurement scale axes, only time per division.
• Shared: Accommodates the minimum and the maximum of
all traces.
•
Off: No automatic scaling.
Y-Axis Scale Format
Sets the scale format that is used on the graph. Select Linear to
increase the step size in even increments. Select Log to increase
the step size exponentially.
 Loading...