F5 – Information Menu
Gem-5 User’s Manual 249
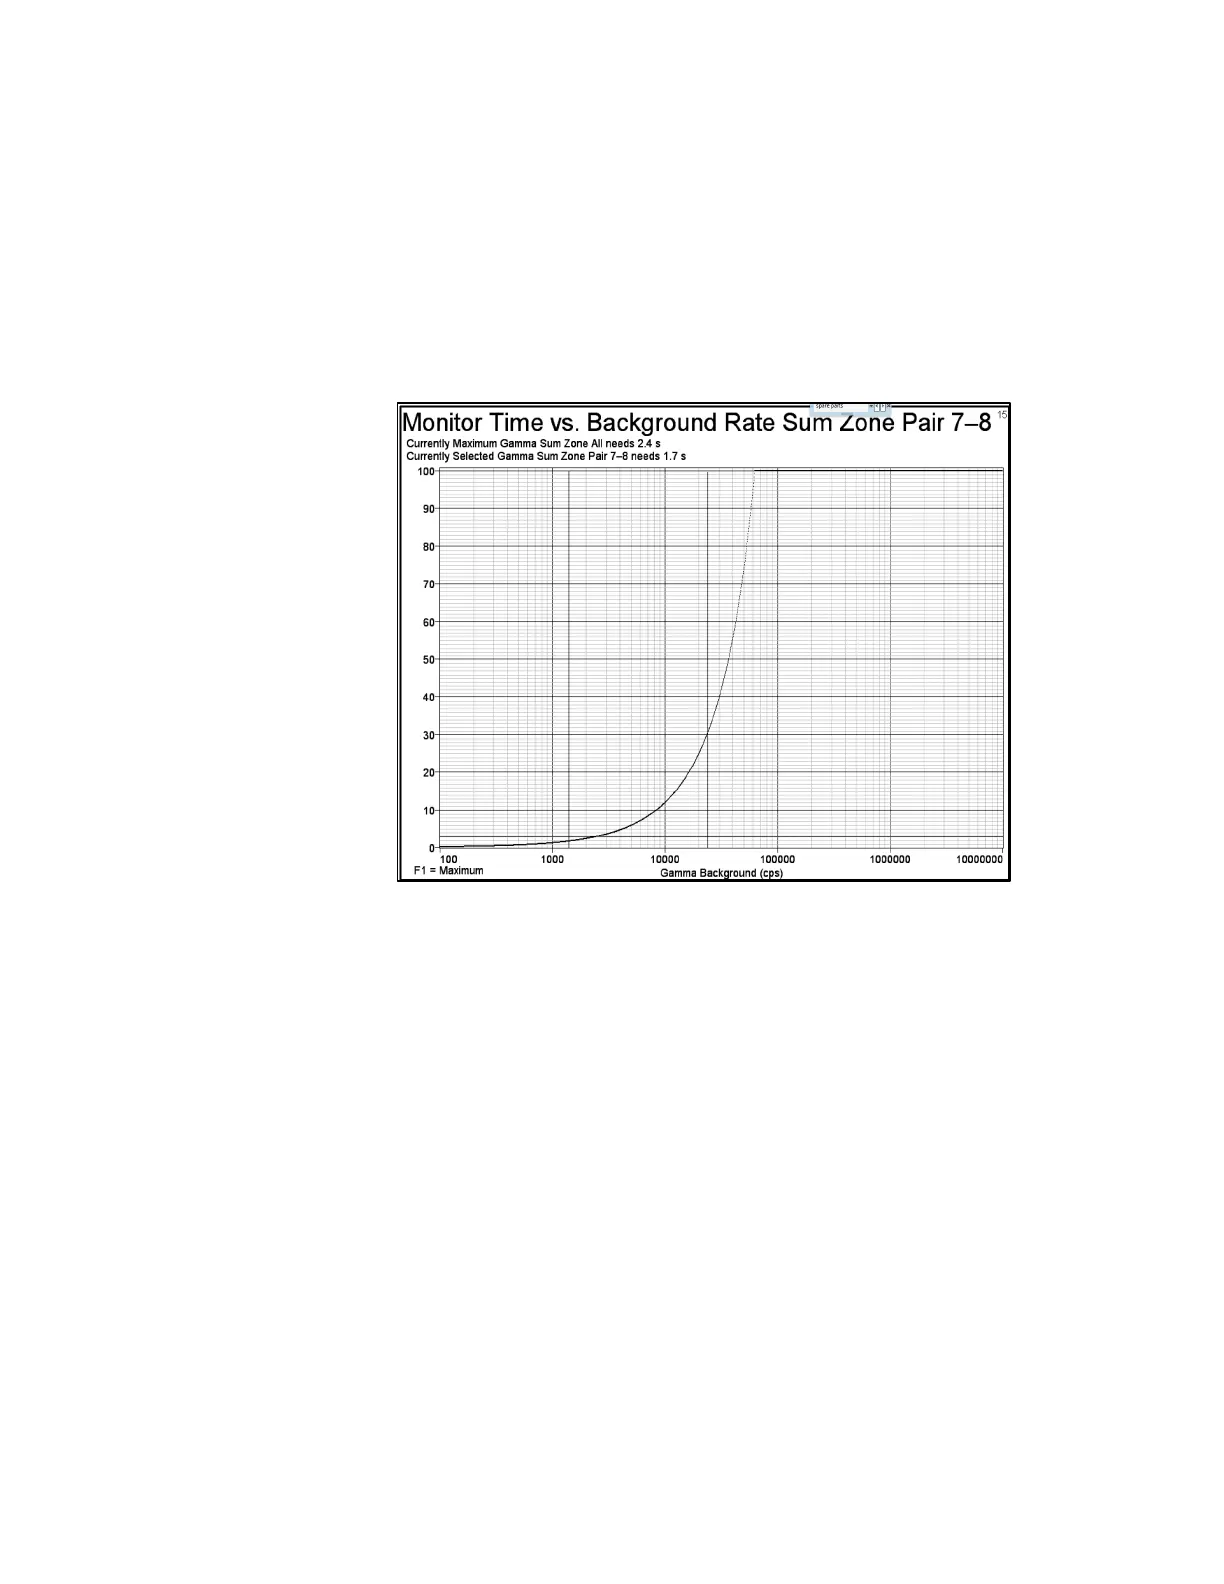
F5 – Monitor Time vs. Alarm Value
The Monitor Time vs. Alarm Value (Activity or Emission Rate) plot (yellow line)
shows how the required monitoring time for the selected detection zone varies with
the alarm set point (Figure 116). As the set point is lowered the counting time for
making the Clean/Contaminated decision increases. The graph reflects the current
conditions and settings for the selected zone, i.e. average background rate,
efficiency, and confidence settings.
Figure 116 Monitor Time vs. Alarm Activity Curve
The X-axis is Alarm Activity and the Y-axis is the time to complete a (one position)
monitor cycle. The screen title and X-axis legend reflect the Alarm Activity units as
set in the F1 – Common Values screen.
By default, this screen initially selects the detection zone that requires the longest
counting time, not considering “Count Gamma Body In Two Steps”. Ctrl+Home,
Home, PgUp, PgDn, End, and Ctrl+End keys select the other zones. Use F1 to
return to the worst-case zone. In addition to the “Currently Gamma Detector/Sum
Zone #” label at the top of the screen, Gamma screens are dark green.
The assigned sequential Zone Number shown in small font at the top right of the
screen is used consistently on service mode screens and printouts where information
for individual zones is shown; this number is a convenient way of locating the zone
of interest when switching between screens.