Chapter 4 Unit Setup
86
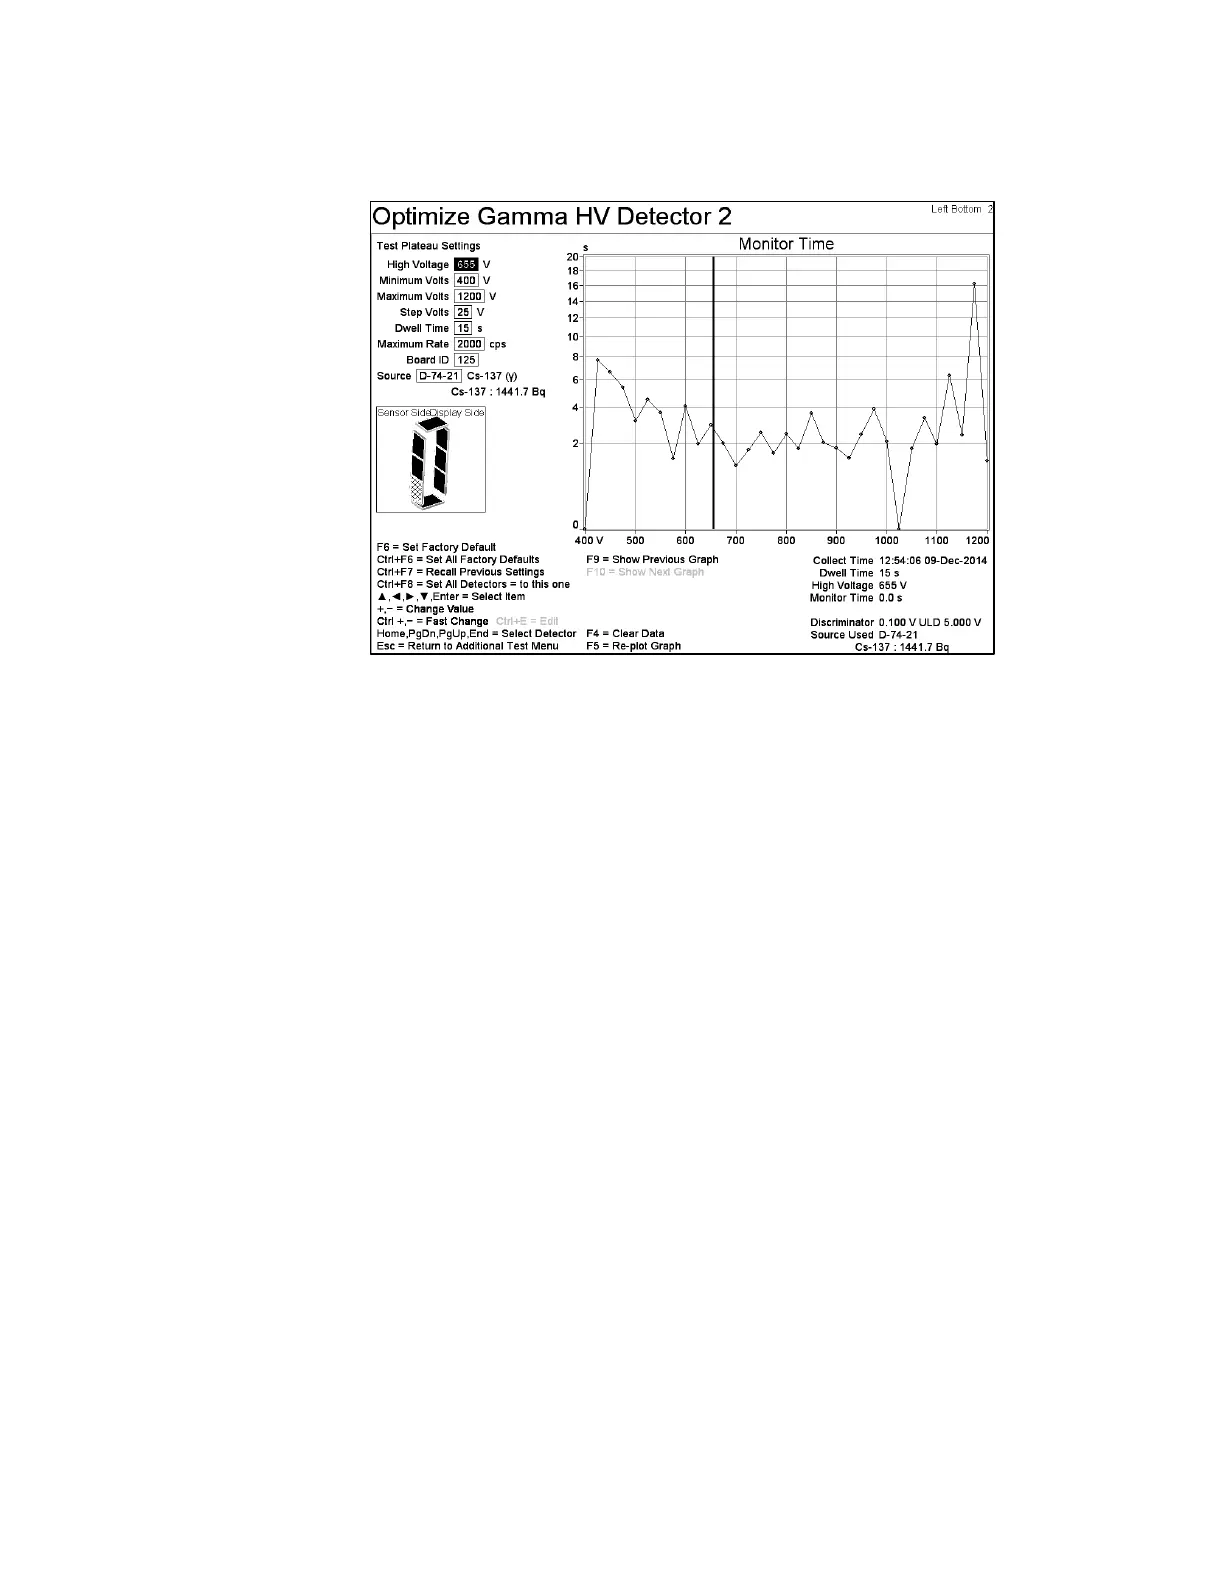
13. Press F10 – Show Next Graph to View Monitor Count Time.
Figure 47 The Optimize Gamma HV Screen, Monitor Time
14. Confirm that voltage selected in step 11 corresponds to minimum count time.
15. Repeat steps 10 to 14, for each Gamma detector.
Results are put into a CSV file in the D:\MonitorProgram\Datalog directory, in a file
with file name OptimizeGammaHV##.CSV where ## is the detector or zone
number. Pressing F3 = Stop Collection saves the data collected to the appropriate
file.
• Files saved use F7 – Data Log, File Type instead of using F8 Printout File
Type settings.
• Most setting are shared with the F9 - Plateau Plot screen (on page 72) but
separate dwell time settings exist so each screen can have its own dwell time
setting.
• Settings High Voltage, Minimum Volts, Maximum Volts, and Step Volts
are shared with F9 - Plateau Plot screen.
• The “Monitor Time” screen uses the “Count Time without T
B
term” equation
(Equation 30 on page 290) so that the curve is not dependent on dwell time
used for collection.
• If the optimization does not apply to a specific detector the F1 = Collect
instruction is replaced with a red message. These message are “Conditional
Service”, “Detector Missing”, “No HV”, or “Optimization Not Required”.